
Weekly Market Update
3/12/18 Market Update
The very big picture:
In the “decades” timeframe, the current Secular Bull Market could turn out to be among the shorter Secular Bull markets on record. This is because of the long-term valuation of the market which, after only eight years, has reached the upper end of its normal range.
The long-term valuation of the market is commonly measured by the Cyclically Adjusted Price to Earnings ratio, or “CAPE”, which smooths out shorter-term earnings swings in order to get a longer-term assessment of market valuation. A CAPE level of 30 is considered to be the upper end of the normal range, and the level at which further PE-ratio expansion comes to a halt (meaning that increases in market prices only occur in a general response to earnings increases, instead of rising “just because”).
Of course, a “mania” could come along and drive prices higher – much higher, even – and for some years to come. Manias occur when valuation no longer seems to matter, and caution is thrown completely to the wind as buyers rush in to buy first and ask questions later. Two manias in the last century – the 1920’s “Roaring Twenties” and the 1990’s “Tech Bubble” – show that the sky is the limit when common sense is overcome by a blind desire to buy. But, of course, the piper must be paid and the following decade or two are spent in Secular Bear Markets, giving most or all of the mania gains back.
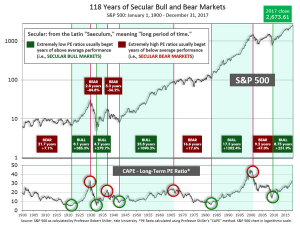
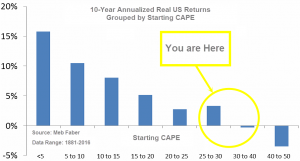
See Fig. 1 for the 100-year view of Secular Bulls and Bears. The CAPE is now at 33.71, up from the prior week’s 32.56, and still exceeds the level reached at the pre-crash high in October 2007. This value is at the lower end of the “mania” range. Since 1881, the average annual return for all ten year periods that began with a CAPE around this level have been in the 0% – 3%/yr. range. (see Fig. 2).
In the big picture:
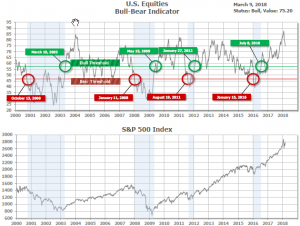
The “big picture” is the months-to-years timeframe – the timeframe in which Cyclical Bulls and Bears operate. The U.S. Bull-Bear Indicator (see Fig. 3) is in Cyclical Bull territory at 75.20, up from the prior week’s 75.00.
In the intermediate and Shorter-term picture:
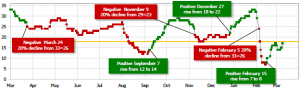
The Shorter-term (weeks to months) Indicator (see Fig. 4) turned positive on February 15th. The indicator ended the week at 17, up from the prior week’s 14. Separately, the Intermediate-term Quarterly Trend Indicator – based on domestic and international stock trend status at the start of each quarter – was positive entering January, indicating positive prospects for equities in the first quarter of 2018.
Timeframe summary:
In the Secular (years to decades) timeframe (Figs. 1 & 2), the long-term valuation of the market is simply too high to sustain rip-roaring multi-year returns – but the market has entered the low end of the “mania” range, and all bets are off in a mania. The only thing certain in a mania is that it will end badly…someday. The Bull-Bear Indicator (months to years) is positive (Fig. 3), indicating a potential uptrend in the longer timeframe. In the intermediate timeframe, the Quarterly Trend Indicator (months to quarters) is positive for Q1, and the shorter (weeks to months) timeframe (Fig. 4) is positive. Therefore, with internal unanimity expressed by all three indicators being positive, the U.S. equity markets are rated as Positive.
In the markets:
U.S. Markets: The Nasdaq Composite hit a new record, and all of major U.S. indexes were brought back into positive territory year-to-date following a strong rally on Friday. The technology-heavy NASDAQ fared the best of the major indexes while the small-cap Russell 2000 also performed especially well. The Dow Jones Industrial Average added almost 800 points last week, rising 3.3% and closing at 25,335.74. The Nasdaq Composite rose 4.2% and closed at 7,560—an all-time high. By market cap, small caps outperformed large caps with the small cap Russell 2000 and mid cap S&P 400 gaining 4.2% and 3.8%, respectively, while the large cap S&P 500 added 3.5%.
International Markets: Canada’s TSX reversed most of last week’s losses rising 1.3%. In Europe, major markets were all in the green. The United Kingdom’s FTSE added 3.8%, France’s CAC 40 rose 2.7%, and Germany’s DAX gained 3.6%. In Asia, China’s Shanghai Composite rebounded 1.6% from last week’s close and Japan’s Nikkei finished up 1.4%. As grouped by Morgan Stanley Capital International, developed markets added 2.0% while emerging markets gained 3.4%.
Commodities: In contrast to the strong move upward in world equity markets, gold remained essentially flat rising just $0.60 on the week and closing at $1324 an ounce. Silver added $0.14 to close at $16.61, a gain of 0.9%. The industrial metal copper, viewed by many analysts as an indicator of global economic health due to its variety of uses, gained 0.4% last week. In energy, the price of West Texas Intermediate crude oil rose $0.79 to $62.04 per barrel, a gain of 1.3%.
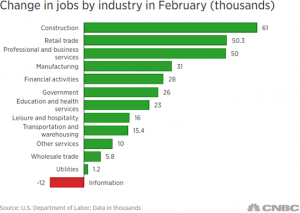
U.S. Economic News: According to the Labor Department, the U.S. added 313,000 new jobs in February. This was a blowout that crushed expectations. Economists had been expecting nonfarm payroll growth of only 200,000. In addition, the Labor Department reported an increase in the labor force participation rate to its highest level since September, with the total employed up 785,000 to a record 155.2 million. Greg Peters, senior investment officer at PGIM Fixed Income stated, “The underlying economic growth is quite strong, but there’s no real pressures from a wages and inflation standpoint. It’s very good for risk assets.” In the details of the report, construction jobs led the way with 61,000 new positions, followed by retail and professional and business services (50,000 each). And it appears inflation may be held in check for a bit longer, wage growth came in less than expected, up just 0.1% for the month.
After setting a nearly 50-year low last week, jobless claims jumped this week by 21,000 to 231,000 but remained far below the 300,000 threshold that analysts use to indicate a healthy jobs market. Last week’s level of claims was its highest in six weeks. Economists had expected only 220,000 new claims. The less-volatile monthly average of claims ticked up 2,000 to 222,500, still just slightly above a 50-year low. Continuing claims, which counts the number of people already receiving benefits, fell by 65,000 to 1.87 million. That number is reported with a one-week delay.
In a separate report concentrating solely on private-sector employment, payroll processor ADP reported data from its latest survey showed the jobs market was “red hot”. ADP reported the economy added 235,000 private-sector jobs last month, its fourth consecutive month of plus 200,000 job gains. Economists had expected an increase of only 205,000 private-sector jobs. In the details of the report, small firms added 68,000 jobs, medium-sized businesses added 97,000, and large companies added 70,000. Job gains were led by the retail and leisure/hospitality sectors as consumer spending remained strong. Mark Zandi, chief economist of Moody’s Analytics remarked, “The job market is red hot and threatens to overheat.”
Despite the continued labor shortage and higher prices, businesses in the services sector are continuing to grow rapidly, according to the Institute for Supply Management (ISM). ISM’s non-manufacturing survey of service-oriented companies such as hospitals, retailers, and restaurants, fell 0.4 points to 59.5 last month after hitting its highest level in nearly 12 years. Readings over 50% are viewed as positive for the economy, while anything over 55% is considered exceptional. In the details of the report, the index for employment fell 6.6 points to 55, while the index for new orders hit a 12-year high of 64.8. 16 of the 17 industries tracked by ISM said their businesses were expanding. Overall, the report shows the economy continues to be on strong footing, so much so that companies increasingly complain about a shortage of skilled workers and supply cost increases. It is widely feared that if the cost of labor and materials continue to rise, the Federal Reserve may have to raise interest rates more rapidly, a potential brake on the economy.
The borrowing of the nation’s consumers slowed in January, according to the Federal Reserve. Total consumer credit increased by $13.9 billion to a seasonally-adjusted record $3.85 trillion—an annual growth rate of 4.3%. That was down from $19.2 billion in December and the smallest gain since September. In the details of the report, revolving credit, which includes credit card spending, slowed dramatically in January – up just 0.8% – following December’s 7.2% gain. It was its smallest gain since February of 2015. Non-revolving credit, which includes auto and student loans, rose 5.6% in January, its second month of gains.
The U.S. trade deficit rose 5% in January, hitting a nearly 10-year high and continuing its steady rise since President Trump took office. The deficit was up 16% compared to the same time last year. Imports remained unchanged at $257.5 billion, with the biggest increase in petroleum imports in three years offset by declines in cellphones, computer chips, and other consumer goods. Exports were down 1.3%, primarily due to a big drop in shipments in the volatile commercial aircraft sector. The high U.S. trade deficit has been a major concern for President Trump who has vowed to bring it down sharply. Michael Pearce, senior U.S. economist at Capital Economics released a note stating, “The increase in the trade deficit to a nine-year high … suggests that net trade will once again be a drag on economic growth in the first quarter, and will only add fuel President Donald Trump’s protectionist rhetoric in recent weeks.”
The Federal Reserve’s Beige Book, a collection of anecdotes from each of the Federal Reserve banks about economic conditions in their respective districts, reported growth remained at a modest-to-moderate pace in the first two months of the year. In short, the report saw inflation pressures building across the board. The Beige Book said, “Prices increased in all districts. Most districts saw employers raise wages and expand benefit packages in response to tight labor market conditions.” Nonetheless, overall wage and price growth was described as “moderate”. The report gives the Fed the green light to continue raising its benchmark interest rates in coming meetings. Fed Chairman Jerome Powell and many of his colleagues have expressed confidence in recent speeches that inflation will move higher. The market is expecting a rate hike at the next Fed meeting later this month.
International Economic News: Canada’s jobless rate dropped to a 10-year low of 5.8% last month. Statistics Canada reported the economy added 15,400 jobs in February on a seasonally-adjusted basis, but that missed expectations of a 21,000 advance in employment. TD Securities said in a note that the latest report, “essentially takes the pace of [job] growth back to earth from last year’s sky highs gains.” Canada’s jobs report comes amid growing uncertainty over its economic outlook as U.S. President Trump pushes for a renegotiation of the North American Free Trade Agreement.
Growth in the services sector of the United Kingdom, which makes up roughly 80% of the UK’s economy, hit a four-month high last month according to the latest IHS Markit Purchasing Managers’ Index (PMI) for services. The index hit 54.5 last month, up 1.5 points from January and exceeding economists’ expectations by 2.3 points. Despite the positive performance from the services sector, economists expect the U.K. economy to grow just 0.4% in the first quarter due to weakness in the manufacturing sector. According to the Office for National Statistics, manufacturing output increased only 0.1% for the month. While positive, it missed forecasts of a 0.2% rise. Economists’ are concerned about an overall picture of “slowing momentum” in the UK’s manufacturing sector.
On Europe’s mainland, French economy minister Bruno Le Maire took to the social media platform Twitter to announce his disappointment with U.S. President Trump’s decision to impose steep tariffs on imported steel and aluminum and vowed an “appropriate response”. Le Maire tweeted, “France regrets announcements of @realDonaldTrump on steel & aluminum tariffs. There are only losers in a trade war. With our EU partners, we will assess consequences on our industries and agree appropriate response.” The European Union’s commissioner on trade policy, Cecilia Malmstrom, was quick to point out that she would “seek more clarity on this issue in the days to come”, and that she believed the EU would be exempt from the tariffs.
Germany, Europe’s economic powerhouse, looks like it lost some of its momentum at the beginning of the year but economists remained confident that the weakness is only temporary. Factories in Germany and the rest of the Eurozone area have seen slower activity, with momentum in China and Japan weakening as well. The Economy Ministry, which publishes data on factory orders and industrial production, reported factory orders declined -3.9% in January, while industrial production weakened -0.1%. Exports retreated -0.5%. Carsten Brzeski, chief economist at ING-Diba in Frankfurt stated, “Some darker clouds have appeared in the German economic sky.” But “at least for the near term, there is plenty of evidence that the German economy will power ahead.”
The Chinese government is predicting a slowdown in growth for this year, announcing its 2018 growth target of 6.5%, several notches below the 6.9% rate at which it expanded last year. The target, announced at the start of the National People’s Congress, was in line with economists’ forecasts. The economic growth target is part of a broader “work report” delivered each year by Chinese Premier Li Keqiang in which he provides other details about the government’s plans and expectations for the country’s huge economy. The central government intends to shrink its budget deficit to 2.6% of GDP from 3% in 2017 – the first time it has cut this ratio in more than five years.
The Bank of Japan kept its policy steady and reiterated its upbeat view of the economy. “Japan’s economy is expanding moderately, with a virtuous cycle from income to spending operating,” the BOJ said in a statement announcing the policy decision. In the widely expected non-move, the BOJ maintained its short-term interest rate target at -0.1%, and stated it would work to guide 10-year government bond yields around zero percent. In other data, the Japanese Cabinet Office stated the economy grew at an annualized rate of 1.6% in the last quarter of last year, much stronger than its initial estimate. The strength appeared due to strong domestic demand and private investment.
Finally: As the number of jobs created by the U.S. economy blew away Wall Street expectations, one of the most notable aspects of the report was the strong rebound in the construction industry. Last month over 60,000 jobs were created and the sector has added 185,000 jobs over the past four months. The rebound in construction bodes well for the U.S. economy as the housing market is a key pillar in the strength of the overall economy. On the other hand, the billionaires in Silicon Valley actually subtracted from employment gains, with a net loss of 12,000 jobs in the “Information” category.
(sources: all index return data from Yahoo Finance; Reuters, Barron’s, Wall St Journal, Bloomberg.com, ft.com, guggenheimpartners.com, zerohedge.com, ritholtz.com, markit.com, financialpost.com, Eurostat, Statistics Canada, Yahoo! Finance, stocksandnews.com, marketwatch.com, wantchinatimes.com, BBC, 361capital.com, pensionpartners.com, cnbc.com, FactSet)
Indices mentioned are unmanaged and cannot be invested into directly. Past performance is no guarantee of future results. All Investing involves risk. Depending on the types of investments, there may be varying degrees of risk. Investors should be prepared to bear loss, including total loss of principal.