
1-15-2024 Weekly Market Update
The very Big Picture
The long-term valuation of the market is commonly measured by the Cyclically Adjusted Price to Earnings ratio, or “CAPE”, which smooths-out shorter-term earnings swings in order to get a longer-term assessment of market valuation. A CAPE level of 30 is considered to be the upper end of the normal range, and the level at which further PE-ratio expansion comes to a halt (meaning that further increases in market prices only occur as a general response to earnings increases, instead of rising “just because”).
Of course, a “mania” could come along and drive prices higher – much higher, even – and for some years to come. Manias occur when valuation no longer seems to matter, and caution is thrown completely to the wind – as buyers rush in to buy first, and ask questions later. Two manias in the last century – the “Roaring Twenties” of the 1920s, and the “Tech Bubble” of the late 1990s – show that the sky is the limit when common sense is overcome by a blind desire to buy. But, of course, the piper must be paid, and the following decade or two were spent in Secular Bear Markets, giving most or all of the mania-gains back.
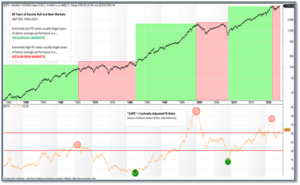
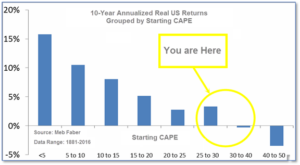
See Fig. 1 for the 100-year view of Secular Bulls and Bears. The CAPE is now at 32.20, up from the prior week’s 31.78. Since 1881, the average annual return for all ten-year periods that began with a CAPE in this range has been slightly positive to slightly negative (see Fig. 2).
Note: We do not use CAPE as an official input into our methods. However, if history is any guide – and history is typically ‘some’ kind of guide – it’s always good to simply know where we are on the historic continuum, where that may lead, and what sort of expectations one may wish to hold in order to craft an investment strategy that works in any market ‘season’ … whether the current one, or one that may be ‘coming soon’!
The Big Picture:
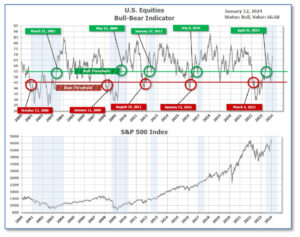
The ‘big picture’ is the (typically) years-long timeframe – the timeframe in which Cyclical Bulls and Bears operate. The U.S. Bull-Bear Indicator finished the week in Bull territory at 66.68 up from the prior week’s 66.17.(see Fig. 3)
In the Quarterly- and Shorter-term Pictures
The Quarterly-Trend Indicator based on the combination of U.S. and International Equities trend-statuses at the start of each quarter – was Positive entering January, indicating positive prospects for equities in the first quarter.
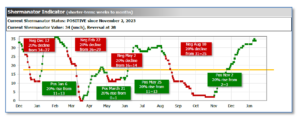
Next, the short-term(weeks to months) Indicator for US Equities turned positive on November 2, and ended the week at 34, up 2 from the prior week.
In the Markets:
U.S. Markets: Stocks moved up this week, as large-cap growth stocks and the Nasdaq Composite Index outperformed the broader market. Tech giants, such as chipmaker NVIDIA, recorded solid gains, while energy stocks and oil prices pulled back. The Dow Jones Industrial Average added 0.3%, closing the week at 37,593. The technology-heavy NASDAQ increased by 3.1%. By market cap, the large cap S&P 500 gained 1.8%, while the mid cap S&P 400 rose 0.6%. The small cap Russell 2000 remained relatively unchanged, closing at 1,951.
International Markets: The international indexes finished the week mixed. Canada’s TSX ticked up 0.3%, while the UK’s FTSE 100 dropped by -0.8%. France’s CAC 40 and Germany’s DAX climbed up 0.6% and 0.7%, respectively. In Asia, China’s Shanghai Composite retreated -1.6%. Japan’s Nikkei advanced 6.6%. As grouped by Morgan Stanley Capital International, developed markets rose 1.2%, while emerging markets gave up -0.6%.
Commodities: Precious metals finished the week mixed as well. Gold modestly increased by 0.1% to $2,051.60 an ounce. Silver also ticked up by 0.1% to $23.33 an ounce. The industrial metal copper, viewed by some analysts as a barometer of world economic health due to its wide variety of uses, fell by -1.72%. West Texas Intermediate crude oil retreated -1.53% to $72.68 per barrel.
U.S. Economic News: The labor market seems to remain healthy as U.S. initial jobless benefit claims inched lower again. First-time unemployment-benefit claims fell by 1,000 to a total of 202,000, the Labor Department said. Economists had forecasted an increase to 210,000 new jobless claims. The number of individuals already collecting unemployment benefits decreased by 34,000, declining to 1.83 million in total. Since the end of November 2023, continuing claims have fallen by 90,000. The Labor Department’s recent data suggests that “businesses are not laying off workers but are cutting back on hiring. This is consistent with slower but still positive employment growth as seen in the monthly jobs’ numbers and the hiring data,” said Stuart Hoffman, senior economic adviser at PNC Financial Services Group.
The rise in consumer prices accelerated at the end of 2023, interrupting a slowdown in inflation. The consumer price index rose by 0.3% in December, which marked its starkest increase in the fourth quarter. Over the past year, the rate of inflation also moved up from 3.1% in November to 3.4%. The core rate of inflation, viewed by some as a more accurate predictor of future price trends, increased by 0.3% last month, which was in line with economists’ estimates. The annual rate of core inflation modestly decreased from 4% to 3.9% in December. “The data indicates that we are clearly moving in the right direction,” New York Federal Reserve President John Williams said. “However, we still are a ways from our price stability goal,” Williams added.
Wholesale prices in the U.S. fell in December for the third consecutive month. The producer price index report elucidates what companies pay for supplies such as fuel, packaging, and so forth. At the retail level, these costs are handed down to customers and serve as an indication of whether inflation is rising or falling. Economists forecasted a 0.1% increase in the producer price index. A decline in wholesale inflation is usually followed by a mild reading in the PCE index, which is the Fed’s preferred measure of inflation. A separate measure of core wholesale prices, which omits food, energy, and trade margins, ticked up by 0.2% last month, the government said. The cost of goods decreased by 0.4% last month, due to another decline in energy prices. Food prices dropped off as well. The cost of wholesale services flattened in December. Wholesale prices over the past 12 months edged up from 0.8% in November to 1.0%. The core prices through 2023 ticked up from 2.4% to 2.5%. The cost of partly finished goods shed 0.6%, while prices of raw materials decreased by 4.4%.
International Economic News: Canada’s trade surplus narrowed to C$1.57 billion ($1.17 billion) in November as precious metals led the first decline in exports in five months, data from Statistics Canada showed. The surplus came in below the C$2 billion median forecast made by analysts. Statistics Canada revised October’s surplus to C$3.20 billion from a previously reported C$2.97 billion. Total exports declined by 0.6%, while imports increased by 1.9%. “I’d call this a flat result after some positive months,” said Stuart Bergman, chief economist at Export Development Canada. “On a macro level, we see slower growth in the first half of 2024 and then things starting to pick up in the second half of the year and into 2025,” Bergman said. The Bank of Canada said in December that pressures on the labor market had eased and stalled growth between the second and third quarters had left the economy without excess demand. Statscan said gross domestic product likely rose 0.1% in November, after economic growth had flattened in October. By volume, exports ticked down 0.1% as well. The decline in exports was likely due to lower exports of unwrought gold, silver, and platinum group metals in the banking sector. The primary drivers of import growth were energy products and industrial machinery. By volume, total imports were up 1.6%. Under the energy segment, imports of nuclear fuel and other energy products increased the most, mainly on higher imports of uranium from Kazakhstan, Statscan said. Imports of refined petroleum energy products increased alongside higher imports of motor gasoline and aviation fuel from the United States. “Canada’s trade balance should swing back into deficit territory as auto imports normalize following US strike impacts, while demand for Canadian exports will be limited by high interest rates globally,” said Katherine Judge, an economist at CIBC Economics.
Across the Atlantic, British employers increased pay and modestly regained their hiring appetite in December, according to a survey released by the Bank of England. The Recruitment and Employment Confederation (REC) survey, which was based on responses from 400 recruitment agencies collected in December, showed hiring of permanent workers shrank less noticeably than in November. The REC survey showed vacancies fell for the third time in four months and the availability of candidates to fill jobs increased again. Pay for new hires in permanent and temporary roles accelerated in December as well, when compared to November’s reading. “The slowdown in our labour market seems to be easing a bit,” said Neil Carberry, the REC’s chief executive. “Given that December is a time when employers generally postpone activity into the new year, this is a positive sign that the labour market is weathering the current economic storm,” Carberry added.
On Europe’s mainland, Germany’s wholesale sector sentiment plunged at the start of the new year, according to the Federation of German Wholesale, Foreign Trade and Services (BGA). Its bi-annual wholesale indicator dropped 8.2 points to a total of 69.4 in the second half of last year, submerging the gauge further below the 100 threshold which separates positive and negative sentiment. The current reading is barely above 70 points. 61% of firms in the wholesale sector reported to be politically discontent and called for a fundamental change of course, with only 1% satisfied with the government. “A rapid economic recovery isn’t in sight,” said Dirk Jandura, BGA’s president. “While others have already recovered, we in Germany are stuck in an economic dead end with structural brakes of our own making.” Proposals for improvements include tax reductions, alongside abolishing the country’s strict supply chain law, which according to the BGA president, is an almost greater burden on companies than high energy prices. “Our companies are the ones who have taken on social and societal responsibility, who have brought the German economy through the crises of recent years so well… And that will be the case this time too,” added Jandura.
Nuclear power production in the European Union’s second-largest economy surged at the start of the new year. According to power generation data compiled by the London Stock Exchange Group (LSEG), nuclear generation in January 2024 jumped 18% compared to the same period in 2023. Meanwhile, data from the International Energy Agency (IEA) showed France’s higher output overlapped with a cold snap in Nordic countries, allowing Europe’s largest electricity exporter to boost power flows to neighboring nations at the start of this year. If France’s nuclear generation totals remain above 2023’s stunted levels in the subsequent months, the country may be able to sustain its latest high levels of clean power exports to neighboring nations. So far through 2024, France’s main power firm Électricité de France (EDF) managed to surpass output levels in early 2023 and 2022, although production continues to lag 2021’s total by around 10%. EDF said it is targeting total nuclear output of 365 terawatt hours (TWh) by 2025, compared to just under 320 TWh in 2023. According to the International Energy Agency (IEA), in recent weeks France has been an average daily net exporter of over 12.2 gigawatts (GW) of power, with nearly 3 GW heading to Germany and a further 6 GW distributed to Switzerland, the United Kingdom and Italy.
In China, exports increased at a faster pace in December, while deflationary pressures persisted. Exports rose by 2.3% last month, when compared to the same period a year earlier, customs data showed. Meanwhile, imports grew by 0.2% year-on-year, coming in below a 0.3% forecast. “The better export data is first and foremost driven by semiconductors and electronics, and the recovery on that side comes from a cyclical rebound in consumer demand overseas,” said Xu Tianchen, senior economist at the Economist Intelligence Unit. The improved Chinese export data came in alongside those from South Korea, Germany, and Taiwan, suggesting that global trade could make a comeback. Especially as South Korea’s exports, which is a closely watched indicator of global trade, rose for the third month in December. “Exports improved on the margin… but exports as a pillar for growth in China are not strong enough to boost overall domestic demand,” Pinpoint Asset Management’s Zhang said.
The Tokyo inflation data, closely watched as a leading indicator of nationwide price trends, slowed for the second consecutive month in December, data from the Bank of Japan showed. Tokyo’s core consumer price index (CPI), which excludes food, yet includes fuel costs, rose 2.1% year-on-year in December, government data showed. Pressure on the central bank to rush into exiting its ultra-loose monetary policy declined as core inflation in Japan’s capital continued to ease. Due to government subsidies, energy prices dropped by 18.8% in December from a year earlier, the data showed. “Companies are probably keen to keep raising prices, but the pace of hikes appears to be slowing,” said Yoshiki Shinke, senior executive economist at Da-ichi Life Research Institute. “The hurdle for achieving sustained 2% inflation in Japan is high,” Shinke said, adding that the nationwide core consumer inflation rate will likely fall below the BOJ’s 2% target in late 2024 through early 2025.
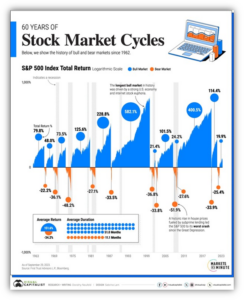
Finally: When it comes to the stock market, sometimes it seems like the underlying normality is abnormality. As you look at the stock market today, you may have noticed some facets that seem unusual to you. The rise in the S&P 500 has exceeded 24% so far, despite robust economic growth and increasing interest rates. Surprisingly, the unemployment rate remained low at 3.7% as of November, and inflation has shown signs of moderation. To paint a picture of the current stock market cycle, the graphic below shows 60 years of bull and bear markets, with data from First Trust. A bear market occurs when a stock market index falls by 20% from its peak. Upon fully recovering and exceeding this peak, the index enters a bull market. The duration of this shift can span months to years. However, historical data since 1962 reveals that bear markets have been shorter in duration compared to bull markets, as illustrated in the table below.

Over this period, the longest bear markets were in the early 70s and 80s, both of which lasted approximately 20 months. Amid a roaring U.S. economy in the 90s, the longest bull market lasted over 12 years, until it reached an apex during the Dotcom boom. During this time, the S&P 500 surged 582.1%. In numerous cases, recessions have subsequently followed stock market peaks. For example, in 2007 the S&P 500 reached a high in October and a recession officially set in by December. In 2000, the S&P 500 peaked in September, which was six months prior to the official start of the 2001 recession.
While no one can predict when a bear market will begin, investors can use some strategies to strengthen their portfolio. Two helpful tactics are diversifying across sectors and asset class diversification. Cyclical sectors, such as tech and real estate, have historically tended to rise when the market is in the green. On the other hand, traditionally more defensive sectors like consumer staples have outperformed when the market takes a turn. Adding bonds into a portfolio typically reduces risk, but of course this is not a certainty. When U.S. stocks are down, international stocks have shown a lower correlation to U.S. equities which may buffer the loss.
Fortunately, the S&P 500 has seen an average historical return of +11.5% since 1928. In general, a significant majority of stock market cycles occur in a bullish market, exhibiting substantial net return appreciation and lasting for an extended period.
(Sources: All index- and returns-data from Norgate Data and Commodity Systems Incorporated; news from Reuters, Barron’s, Wall St. Journal, Bloomberg.com, ft.com, guggenheimpartners.com, zerohedge.com, ritholtz.com, markit.com, financialpost.com, Eurostat, Statistics Canada, Yahoo! Finance, stocksandnews.com, marketwatch.com, visualcapitalist.com, wantchinatimes.com, BBC, 361capital.com, pensionpartners.com, cnbc.com, FactSet.) Content provided by WE Sherman and Company. Securities offered through Registered Representatives of Cambridge Investment Research Inc., a broker-dealer, member FINRA/SIPC. Advisory Services offered through Cambridge Investment Research Advisors, a Registered Investment Adviser. Strategic Investment Partners and Cambridge are not affiliated. Indices mentioned are unmanaged and cannot be invested into directly. Past performance is no guarantee of future results. These opinions of Strategic Investment Partners and not necessarily those of Cambridge Investment Research, are for informational purposes only and should not be construed or acted upon as individualized investment advice.