
1-29-2024 Weekly Market Update
The very Big Picture
The long-term valuation of the market is commonly measured by the Cyclically Adjusted Price to Earnings ratio, or “CAPE”, which smooths-out shorter-term earnings swings in order to get a longer-term assessment of market valuation. A CAPE level of 30 is considered to be the upper end of the normal range, and the level at which further PE-ratio expansion comes to a halt (meaning that further increases in market prices only occur as a general response to earnings increases, instead of rising “just because”).
Of course, a “mania” could come along and drive prices higher – much higher, even – and for some years to come. Manias occur when valuation no longer seems to matter, and caution is thrown completely to the wind – as buyers rush in to buy first, and ask questions later. Two manias in the last century – the “Roaring Twenties” of the 1920s, and the “Tech Bubble” of the late 1990s – show that the sky is the limit when common sense is overcome by a blind desire to buy. But, of course, the piper must be paid, and the following decade or two were spent in Secular Bear Markets, giving most or all of the mania-gains back.
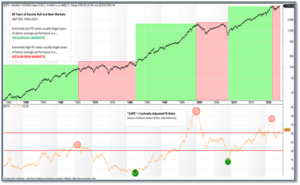
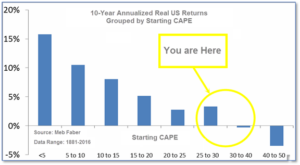
See Fig. 1 for the 100-year view of Secular Bulls and Bears. The CAPE is now at 32.92, up from the prior week’s 32.57. Since 1881, the average annual return for all ten-year periods that began with a CAPE in this range has been slightly positive to slightly negative (see Fig. 2).
Note: We do not use CAPE as an official input into our methods. However, if history is any guide – and history is typically ‘some’ kind of guide – it’s always good to simply know where we are on the historic continuum, where that may lead, and what sort of expectations one may wish to hold in order to craft an investment strategy that works in any market ‘season’ … whether the current one, or one that may be ‘coming soon’!
The Big Picture:
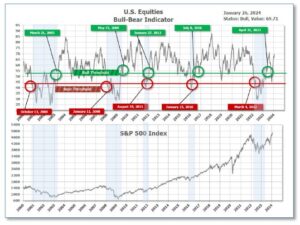
The ‘big picture’ is the (typically) years-long timeframe – the timeframe in which Cyclical Bulls and Bears operate. The U.S. Bull-Bear Indicator finished the week in Bull territory at 69.71 up from the prior week’s 67.96.(see Fig. 3)
In the Quarterly- and Shorter-term Pictures
The Quarterly-Trend Indicator based on the combination of U.S. and International Equities trend-statuses at the start of each quarter – was Positive entering January, indicating positive prospects for equities in the first quarter.
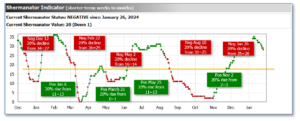
Next, the short-term(weeks to months) Indicator for US Equities turned negative on January 26, and ended the week at 28, down 4 from the prior week.
In the Markets:
U.S. Markets: Stocks moved up again this week. The gains were relatively broad, but the small-cap Russell 2000 Index remained below its all-time intraday high by approximately 20%. Major movers were mixed this week. After the company missed both earnings and revenue estimates, Tesla fell sharply. However, Netflix had a surge of subscriber additions and recorded solid gains. The Dow Jones Industrial Average added 0.6%, closing the week at 38,109. The technology-heavy NASDAQ rose 0.9%. By market cap, the large cap S&P 500 increased by 1.1%, while the mid cap S&P 400 rose 0.8%. The small cap Russell 2000 gained 1.7%, closing at 1,978.
International Markets: The majority of the international indexes recorded gains as well. Canada’s TSX rose by 1.0%, while the UK’s FTSE 100 climbed up 2.3%. France’s CAC 40 and Germany’s DAX advanced 3.6% and 2.5%, respectively. In Asia, China’s Shanghai Composite added 2.8%. Japan’s Nikkei ticked down -0.6%, the only international index in the red this week. As grouped by Morgan Stanley Capital International, developed markets rose by 1.5%, while emerging markets gained 1.3%.
Commodities: Precious metals finished the week mixed. Gold decreased by -0.59% to $2,017.30 an ounce. Silver ticked up 0.71% to $22.87 an ounce. The industrial metal copper, viewed by some analysts as a barometer of world economic health due to its wide variety of uses, gained 1.73%. West Texas Intermediate crude oil advanced 6.50% to $78.01 per barrel.
U.S. Economic News: The S&P flash U.S. services PMI and manufacturing PMI, which provide a sense for the economic condition in the new year, rose to 52.9 and 50.3, respectively. While the U.S. economy seemed to soften up to the final quarter of 2023, economic growth appeared to keep a healthy pace. New orders, which are a sign of future sales, increased for both goods and services this month. The prices businesses pay for supplies rose modestly; alongside the prices they charge customers. However, production declined as manufacturers reduced excess inventories. “For now, the surveys send a clear and welcome message of resilient economic growth and sharply waning inflation,” said Chris Williamson, S&P business economist.
The leading economic index, a gauge designed to show the health of the economy, slid 0.1% in December. Since the stretch of negative readings began in 2022, this marked the index’s most modicum decline. Economists anticipated a drop of 0.3%. According to a report published by the Conference Board, six of the ten indicators in the survey were positive in December, a notable improvement compared to past quarters. Through a period of high inflation and rising interest rates, the economy persisted to grow by 4.9% year-on-year in the third quarter of 2023, while GDP is estimated to have expanded by almost 2% in the fourth quarter. “Overall, we expect GDP growth to turn negative in the second and third quarters of 2024, but begin to recover late in the year,” said senior manager of business cycle indicators, Justyna Zabinska-La Monica.
Orders for durable U.S. manufactured goods were unchanged from the 5.5% rebound in November, said the Commerce Department’s Census Bureau. On a year-on-year basis orders had increased 4.4% in December. Last month’s orders were weighed down by a slump in transportation equipment. November’s 15.3% surge in orders for transportation equipment was followed by a 0.9% decline in December. Meanwhile, orders for motor vehicles and parts ticked up 0.4%. Civilian aircraft orders rose by 0.4% as well, while orders for defense aircraft decreased by 2.9%. Non-defense capital goods orders, excluding aircraft, which is a key indicator of business spending intentions, ticked up 0.3% following a revised increase of 1.0% in the prior month. Previously reported as rebounding by 0.8% in November, these core capital goods orders remained steady. Meanwhile, core capital goods shipments saw a marginal gain of 0.1%, while shipments of non-defense capital goods added 0.6%. These shipments contribute to the calculation of equipment spending in the gross domestic product report. After expanding at a 4.9% pace in the third quarter, the economy grew at an annualized rate of 3.3% in the final quarter of 2023.
The Labor Department reported that initial jobless claims climbed to 214,000, an increase of 25,000 from the prior week. Economists had expected initial jobless claims to rise to 200,000. The Labor Department said continuing claims, a reading on the number of Americans receiving ongoing unemployment assistance, added 27,000 to 1.833 million in total. The four-week moving average of continuing claims decreased by 13,250 to 1,835,000. “Initial jobless claims rose more than expected, as lingering seasonal noise contributed to another big swing in claims,” said Nancy Vanden Houten, Lead U.S. Economist at Oxford Economics. “The seasonal volatility in claims is largely behind us. We may see a modest rise in claims as labor market conditions ease further as growth slows in 2024. We don’t expect a sharp rise in claims, however, as we look for job growth to slow, but remain positive,” added Vanden Houten.
In December, pending home sales surged as decreasing mortgage rates enticed buyers. Pending home sales represent agreements where contracts have been signed to purchase existing homes, yet the final sale has not been concluded. Economists regard this as an indicator of the likely direction of existing-home sales in the coming months. According to the monthly index released by the National Association of Realtors, pending home sales gained 8.3% last month. The increase in pending home sales was the most significant since June 2020, when it surged by 14.9%. Economists had forecasted a 2% increase last month. The National Association of Realtors anticipates that the 30-year mortgage rate will remain within the range of 6% to 7% for the majority of 2024. The recent rises in contract signings and mortgage applications indicate a build-up in demand from buyers enticed by the declining mortgage rates. However, the housing market’s rebound remains constrained by limited supply. Unless the “lock-in effect” diminishes and more homeowners opt to put their properties on the market, sales won’t see substantial growth. Lawrence Yun, chief economist at the NAR, said in a statement, “The housing market is off to a good start this year, as consumers benefit from falling mortgage rates and stable home prices.”
The rate of U.S. inflation slightly increased last month by a modest 0.2%, based on the Federal Reserve’s preferred PCE gauge. Year-on-Year, the core inflation rate decreased from 3.2% to 2.9% in December. The core rate excludes food and energy expenses, making it a more reliable indicator of future inflation trends. Fluctuations in food and particularly gas prices can be volatile at times. The economy continued to grow at rates exceeding expectations, rather than entering a recession as analysts predicted. Consumer spending experienced a substantial increase last month, gaining 0.7% in the holiday shopping season. In the broader context, while the Fed is expected to lower interest rates this year, the strong growth rate might dissuade immediate action in the coming months, as economists anticipated. Federal Reserve Chairman Jerome Powell cautioned in December that sustained growth could maintain upward pressure on prices and postpone the return to a 2% annual inflation rate. Jay Hawkins, senior economist at BMO Capital Markets, said, “The easing core inflation should pave the way for Federal Reserve interest rate cuts later this year.”
International Economic News: In Canada, the central bank decided to hold its main interest rate at 5%. According to Bank of Canada Governor Tiff Macklem, the central bank has not ruled out further policy rate increases should new developments push prices higher. In a statement, the Bank of Canada said inflation is expected to remain near 3% through the early quarters of 2024, before slowing to 2% next year. The central bank said measures of core inflation have not showed sustained declines. The inflation rate had picked up momentum in the fourth quarter of 2023, climbing from 3.1% in November to 3.4% last month. Canadian core inflation accelerated as well in December, up 3.65%, based on an average of the central bank’s preferred gauges. BoC Governor Tiff Macklem said senior officials are “concerned about the persistence in underlying inflation. We want to see inflationary pressures continue to ease and clear downward momentum in underlying inflation.”
Across the Atlantic, the preliminary S&P Global/CIPS UK Composite PMI, spanning services and manufacturing firms, increased to 52.5 from December’s 52.1 this month. Factories reported an increase in input costs as the re-routing of ships away from the Red Sea added to freight costs. Delivery times were lengthened for the first time in a year. However, there was only a slight rise in the prices charged by manufacturers. James Smith, an economist at Internationale Nederlanden Groep, said the recovery in Britain’s services sector contrasted with weakness in the euro zone where the composite PMI remained in negative territory in January. “The issue for the Bank of England is that inflation is also proving sticky, and the PMI highlights the disruption in the Red Sea,” Smith said.
On Europe’s mainland, Germany’s economic downturn seemed to worsen as manufacturing and services activity contracted this month, according to a preliminary survey. The HCOB German Flash Composite Purchasing Managers’ Index (PMI), compiled by S&P Global, ticked down from 47.4 in December to 47.1 in January. This was below the 47.8 forecast by economists. The composite PMI index monitors the services and manufacturing sectors, which together account for over two-thirds of the German economy. Business activity in the services sector declined from 49.3 in December to 47.6 this month. “There is still a lot of uncertainty among companies and consumers,” said Ulrich Reuter, president of the German Savings Banks Association (DSGV). “Germany has faced a sluggish start to the new year,” said Cyrus de la Rubia, chief economist at Hamburg Commercial Bank.
French business activity fell at its sharpest pace since the third quarter of 2023, the HCOB’s PMI survey showed this week. The Hamburg Commercial Bank (HCOB) France flash Purchasing Managers Index (PMI) for the country’s services sector, compiled by S&P Global, fell to 45.0 points this month. Economists had forecasted a reading of 46.0 points. The survey showed decreased activity levels as clients were deterred by an uncertain 2024 outlook and as overall weakness across the economy suppressed demand. “The French economy is kicking off 2024 on a slow note. The latest HCOB Flash PMIs show a depressing picture overall,” said Norman Liebke, an economist at Hamburg Commercial Bank. “Even though activity fell for an eighth month, new business overall and from abroad fell at a slower pace. Employment even increased for another month, although only marginally,” Liebke said.
In Asia, the People’s Bank of China (PBOC) announced it was making a 50-basis point cut in the amount of cash banks must hold as reserves. PBOC Governor, Pan Gongsheng, said the bank would release policies on improving commercial property loans. The cut to bank reserves would approximately inject $140 billion of cash into the banking system to support a fragile economy and faltering stock markets. The reserve ratio requirements cut would free 1 trillion yuan for the economy, Pan said. “The RRR cut is a sign that PBOC will stick to a loose monetary stance throughout this year, despite having missed market expectation of a medium-term lending facility (MLF) rate cut earlier,” said Xu Tianchen, senior economist at the Economist Intelligence Unit.
Japan’s exports surged last quarter, as shipments to the U.S. and China increased. Finance ministry data showed that exports advanced 9.8% in December to 9.65 trillion-yen ($65.1 billion) year-on-year. Exports to China, Japan’s most prominent trading partner, increased by 9.6% to 1.77 trillion yen ($12 billion) last month. While shipments of semiconductor manufacturing equipment and cars upheld the expansion, exports of chip, and other varying electronic components, decreased by 22%. Exports to the United States surged 20.4%, which marked 27 straight months of growth. Shipments of cars and auto parts, alongside construction and mining equipment, propelled the increase. “Exports were strong, but it might only be a bounce back after the fall in November. The pace of economic growth in the U.S. and Europe seems to be slowing a bit and China has only just bottomed out so any recovery in exports is likely to be a weak one,” said Takeshi Minami, chief economist at Norinchukin Research Institute.
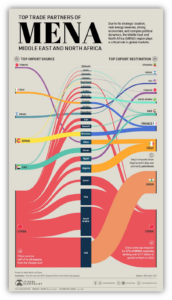
Finally: The Middle East and North Africa (MENA) region plays a significant role in global markets. One way to visualize the economic interconnectedness of the MENA region is by examining its trade partnerships. The graphic below illustrates the top trading partners of MENA countries, offering insights into the patterns and dynamics of international trade in the region. According to statistics provided by the International Monetary Fund (IMF), China emerged as the primary import supplier to MENA nations, providing goods worth over $171 billion to the region in 2022. India also holds significant importance as a trading partner in the region, importing goods valued at more than $50 billion from the United Arab Emirates, with petroleum products accounting for over 40% of these imports. Italy, serving as the foremost exporter to Tunisia, plays a pivotal role in trade with Middle East and North Africa countries. In 2022, Italy acquired goods exceeding $28 billion from Algeria and Libya, with petroleum being the primary commodity. Trade in the region is anticipated to rise, with several nations recently opting to join the BRICS. Between Saudi Arabia, Egypt, and Iran, approximately $1 trillion in exports will be added to the bloc.
(Sources: All index- and returns-data from Norgate Data and Commodity Systems Incorporated; news from Reuters, Barron’s, Wall St. Journal, Bloomberg.com, ft.com, guggenheimpartners.com, zerohedge.com, ritholtz.com, markit.com, financialpost.com, Eurostat, Statistics Canada, Yahoo! Finance, stocksandnews.com, marketwatch.com, visualcapitalist.com, wantchinatimes.com, BBC, 361capital.com, pensionpartners.com, cnbc.com, FactSet.) Content provided by WE Sherman and Company. Securities offered through Registered Representatives of Cambridge Investment Research Inc., a broker-dealer, member FINRA/SIPC. Advisory Services offered through Cambridge Investment Research Advisors, a Registered Investment Adviser. Strategic Investment Partners and Cambridge are not affiliated. Indices mentioned are unmanaged and cannot be invested into directly. Past performance is no guarantee of future results. These opinions of Strategic Investment Partners and not necessarily those of Cambridge Investment Research, are for informational purposes only and should not be construed or acted upon as individualized investment advice.