
2-5-2024 Weekly Market Update
The very Big Picture
The long-term valuation of the market is commonly measured by the Cyclically Adjusted Price to Earnings ratio, or “CAPE”, which smooths-out shorter-term earnings swings in order to get a longer-term assessment of market valuation. A CAPE level of 30 is considered to be the upper end of the normal range, and the level at which further PE-ratio expansion comes to a halt (meaning that further increases in market prices only occur as a general response to earnings increases, instead of rising “just because”).
Of course, a “mania” could come along and drive prices higher – much higher, even – and for some years to come. Manias occur when valuation no longer seems to matter, and caution is thrown completely to the wind – as buyers rush in to buy first, and ask questions later. Two manias in the last century – the “Roaring Twenties” of the 1920s, and the “Tech Bubble” of the late 1990s – show that the sky is the limit when common sense is overcome by a blind desire to buy. But, of course, the piper must be paid, and the following decade or two were spent in Secular Bear Markets, giving most or all of the mania-gains back.
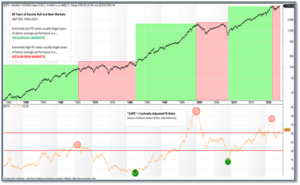
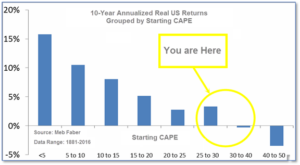
See Fig. 1 for the 100-year view of Secular Bulls and Bears. The CAPE is now at 33.37, up from the prior week’s 32.92. Since 1881, the average annual return for all ten-year periods that began with a CAPE in this range has been slightly positive to slightly negative (see Fig. 2).
Note: We do not use CAPE as an official input into our methods. However, if history is any guide – and history is typically ‘some’ kind of guide – it’s always good to simply know where we are on the historic continuum, where that may lead, and what sort of expectations one may wish to hold in order to craft an investment strategy that works in any market ‘season’ … whether the current one, or one that may be ‘coming soon’!
The Big Picture:
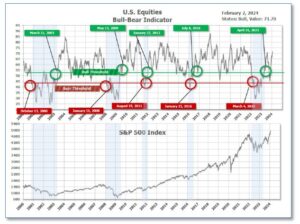
The ‘big picture’ is the (typically) years-long timeframe – the timeframe in which Cyclical Bulls and Bears operate. The U.S. Bull-Bear Indicator finished the week in Bull territory at 71.69 up from the prior week’s 69.71.(see Fig. 3)
In the Quarterly- and Shorter-term Pictures
The Quarterly-Trend Indicator based on the combination of U.S. and International Equities trend-statuses at the start of each quarter – was Positive entering January, indicating positive prospects for equities in the first quarter.
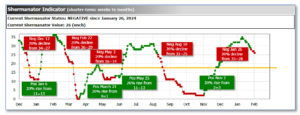
Next, the short-term(weeks to months) Indicator for US Equities turned negative on January 26, and ended the week at 26, down 2 from the prior week.
In the Markets:
U.S. Markets: The major indexes ended the week mixed. The S&P 500 Index and Dow Jones Industrial Average reached intraday highs, while small-cap indexes experienced losses. The improvement seemed restrained, as an equally weighted version of the S&P 500 Index modestly declined. As January came to a close, the S&P 500 gained 1.6% for the month, contrasting with a 0.90% decline in the equal-weight S&P 500 and a nearly 4.0% drop in the small-cap Russell 2000 Index. The Dow Jones Industrial Average added 1.4%, closing the week at 38,654. The technology-heavy NASDAQ rose by 1.1%. By market cap, the large cap S&P 500 increased by 1.4%, while the mid cap S&P 400 ticked up 0.1%. The small cap Russell 2000 retreated -0.8%, closing at 1,963. In the month of January, the Dow Jones Industrial Average gained 1.2%, closing the month at 38,654.4. The NASDAQ added 1.0% month-over-month to a close of 15,629.0. By market cap, the large cap S&P 500 advanced 1.6% to a close of 4,958.6, whereas the S&P MidCap 400 retreated -1.8% to a close of 2,767.1. The small cap Russell 2000 ended the month down -3.9% at a close of 1,962.7.
International Markets: The majority of the international indexes ended the week in the red. Canada’s TSX shed -0.2%, while the UK’s FTSE 100 ticked down -0.3%. France’s CAC 40 and Germany’s DAX dropped by -0.5% and -0.3%, respectively. In Asia, China’s Shanghai Composite retreated -6.2%. Japan’s Nikkei added 1.1%, the lone international index within the G7 to close this week in positive territory. As grouped by Morgan Stanley Capital International, developed markets added 0.1%, while emerging markets fell -0.6%. In the month of January, Canada’s TSK ticked up 0.3% from the prior month, while the UK’s FTSE lost -1.3%. France’s CAC 40 rose 1.5% and Germany’s DAX added 0.9%. In Asia, China’s Shanghai Composite retreated -6.3%, meanwhile Japan’s Nikkei advanced 8.4%. As grouped by Morgan Stanley Capital International, developed markets ticked down -0.5%, while emerging markets shed -4.5%.
Commodities: The majority of precious metals slightly declined by the end of the week. Gold increased by 1.80% to $2,053.70 an ounce. Meanwhile, silver ticked down -0.33% to $22.80 an ounce. The industrial metal copper, viewed by some analysts as a barometer of world economic health due to its wide variety of uses, shed -0.79%. West Texas Intermediate crude oil lost -7.35% to $72.28 per barrel. In the month of January, West Texas Intermediate crude oil rose 5.9%, while Copper added 0.4%. Gold and Silver each retreated by -0.2% and -3.8%, respectively.
U.S. Economic News: Home prices in the U.S.’ twenty largest cities increased for the tenth consecutive month, due to a modest number of home listings. The S&P CoreLogic Case-Shiller twenty-city house price index ticked up 0.1% month-on-month in November. In the last twelve months ending in November, home prices gained 5.4%. The national index increased by 0.2% in November and rose 5.1% year-on-year. The largest year-on-year home-price gains were posted by Detroit. Prices advanced 8.2% and the city’s real-estate market outperformed for the third consecutive month. Next was San Diego at 8%. The only city that saw home prices fall in November was Portland with a -0.7% decline. In December of last year, the median prices of a resale home and a newly built home were $382,600 and $413,200, respectively. Thomas Ryan, property economist at Capital Economics, wrote in a note, “The bigger picture is that house prices have been very strong this year. The small rise in November means that prices are rising at 5.2% y/y, their fastest pace since December 2022.”
Job openings rose to 9 million last month from a revised 8.9 million in November, the Labor Department said. While openings are not always filled, job postings tend to provide an indication into the health of the labor market and broader economy. Federal Reserve officials view a smaller number of openings as an indication that higher interest rates have slowed the economy and inflation. The number of people quitting jobs fell to 3.4 million, which may be a sign of a softer labor market. The majority of the new job openings were in white-collar professional occupations. Manufacturing and health care rose as well. Wholesale and transportation added fewer new job listings, which is normal following the end of the holiday shopping season. From a broader vantage point, layoffs remained low, the unemployment rate is at a modest 3.7%, and the economy has added approximately 200,000 jobs per month. “The good news is that there are options out there if one is still unemployed or is looking for extra work,” said Jennifer Lee, senior economist of BMO Capital Markets. “The bad news is that it means that the consumer could spend more and that’s not what the Fed wants right now,” added Lee.
Consumer confidence rose from a revised 108.0 in December to 114.8 this month, the Conference Board Consumer Confidence Index showed. Economists had expected the index to reach 115.0. Consumer confidence tends to show whether the trajectory of the economy is improving or declining. The Present Situation Index, a measure of how consumers’ feel about current business and labor market conditions, increased from 147.2 to 161.3 month-on-month. Meanwhile, the Expectations Index, based on consumers’ short-term outlook for income, business, and labor market conditions over the next six months, ticked up from 81.9 to 83.8 in January. “Consumer expectations for the next six months increased slightly in January, due to receding pessimism around future business conditions, labor market, and income prospects. Expectations that interest rates will rise in the year ahead plummeted to just 41.5 percent,” said Dana Peterson, chief economist at the board.
The Federal Reserve withheld any indication of an interest rate cut in March. “Based on the meeting today, I would tell you that I don’t think it is likely that the committee will reach a level of confidence by the time of the March meeting to identify March as the time to do that, but that is to be seen,” Federal Reserve Chair Jerome Powell said. According to Omair Sharif, president of Inflation Insights, Powell’s comments indicated that Fed officials were concerned that core goods prices may pick up after months of declines. In core personal consumption expenditures, and the core consumer-price index, “Core goods have been the main driver of the deceleration. It seems like the Fed isn’t convinced that this will last,” Sharif said. “We want to see more good data. It’s not that we’re looking for better data, we’re looking for a continuation of the good data we’ve been seeing,” said Fed Chair Jerome Powell.
In late January, the number of Americans seeking unemployment benefits rose to approximately 224,000, marking the highest level in nearly three months. This uptick could indicate a slight easing in what has otherwise been a robust labor market. Initial jobless claims added 9,000 onto 215,000 in the prior week, based on seasonally adjusted figures. The number of continuing claims in the U.S. increased by 70,000 to 1.9 million. While the hiring rate by businesses has slowed, they’ve seemed reluctant to lay off workers. “We may see a modest rise in claims as labor market conditions ease further,” said Michael Pearce, lead U.S. economist of Oxford Economics. “However, we don’t expect a sharp rise in claims as we look for job growth to slow but remain positive,” Pearce added.
The S&P Global U.S. manufacturing sector PMI registered 50.7 in a final January reading, which exceeded both the flash estimate of 50.3 and December’s reading of 47.9. In January, the ISM new-orders index increased significantly by 5.5 points to 52.5%, which indicated expansion. This marked the second instance of expansion within a span of 20 months. Production gained 0.5 points to 50.4% last month. New export orders fell 4.7 points to 45.2% in January. Prices paid increased to 52.9%, with raw-material prices rising after eight consecutive monthly declines. Among the 18 manufacturing industries, only five, including the chemical sector, reported new orders. ISM officials consider the chemical sector a leading indicator. “In short, the manufacturing sector appears to be past the worst, but we see few signs of a raging rebound looming in the data; a gradual further uptrend in activity is a more reasonable bet,” said chief economist at Pantheon Macroeconomics Ian Shepherdson.
The unemployment rate remained at 3.7% in January. While unemployment remained relatively low, employment gains were concentrated in white-collar profession businesses, retails, and health care. Professional jobs rose by 74,000, retailers added 45,000, and health employment gained 100,000 jobs. “The U.S. labor market started 2024 with another strong jobs report,” said Eric Merlis, managing director and co-head of global markets at Citizens Bank. “The U.S. economy is adding jobs at a fast clip, quelling fears of a recession, but also likely pushing the timing for a rate cut by the Fed farther out in the year, especially since the uptick in average hourly earnings may rekindle inflation concerns,” Merlis added.
Consumer sentiment edged up from a preliminary reading of 78.8 to 79.0 last month, the University of Michigan said. Americans anticipate that inflation will average 2.9% over the next 12 months, which marked the lowest level in four years. Although the current inflation rate stands at 3.4%, it has slowed over the past eighteen months. “After reserving judgment last fall about whether the slowdown in inflation would persist, consumers now feel assured that inflation will continue to soften,” said Joanne Hsu, director of the sentiment survey.
International Economic News: After the Canadian government discontinued pandemic-era support last month, small firms confronted the threat of bankruptcy. In January, small businesses were required to repay interest-free loans totaling C$60,000 ($44,676) that were provided during the pandemic. According to Finance Minister Chrystia Freeland, one-fifth of the 900,000 businesses that received government support have not yet repaid their loans. However, the Canadian Federation of Independent Businesses (CFIB), a small-business lobby group, estimated that a quarter of these businesses missed the repayment deadline. Official data showed that approximately 1.2 million small businesses with employees in Canada in 2021 contributed over a third to the country’s gross domestic product. “There are tens of thousands, if not hundreds of thousands, of businesses that remain viable, but will not be able to outrun their debt,” said Dan Kelly, Canadian Federation of Independent Business (CFIB) president. “We do anticipate… a rise in insolvencies over the next six months or so,” said chief economist at the Chamber of Commerce Stephen Tapp.
Across the Atlantic, The Bank of England (BoE) decided to keep interest rates at 5.25%, but opened the door to possibly cutting them as inflation falls. BoE Governor Andrew Bailey said inflation was “moving in the right direction” and that borrowing costs would be kept “under review.” Six members of the Monetary Policy Committee voted to keep rates at 5.25%, while two members opted for a 0.25 percentage-point hike, and Swati Dhingra backed a 0.25 percentage-point cut. Bailey said price growth was expected to pick up again, which would make it difficult to get inflation down to its 2% target. The BoE Governor said, “For me, the key question has moved from ‘How restrictive do we need to be?’ to ‘How long do we need to maintain this position for?’”
On Europe’s mainland, inflation in Germany eased to 3.1% in January, according to preliminary data from the federal statistics office Destatis. Energy prices were the main factor behind the decrease in German inflation, being 2.8% lower compared to the same month year-over-year. This decline occurred despite the discontinuation of a government measure limiting energy prices and the implementation of a higher carbon price. In January, core inflation, which excludes volatile food and energy prices, stood at 3.4%, slightly down from 3.5% in the prior month. Internationale Nederlanden Groep’s global head of macro Carsten Brzeski said, “The drop in German inflation will fuel speculation about an early European Central Bank rate cut, but underneath a favourable headline inflation there are still enough price pressures to worry about.”
In January, France’s manufacturing sector contracted as sluggish demand and longer delivery times weighed on businesses. The Hamburg Commercial Bank (HCOB) France final purchasing managers index (PMI) for the manufacturing sector, compiled by S&P Global, was at 43.1 points in January. A number under 50 points signifies a decline in activity, whereas above 50 points indicates growth. “The French manufacturing sector is off to a bad start in the new year. This is mainly due to sluggish demand, as also shown by the PMI for new orders. Subsequently, our HCOB Nowcast points to a further contraction in the manufacturing sector in the first quarter of 2024, ” said Norman Liebke, economist at Hamburg Commercial Bank AG.
In Asia, China’s manufacturing activity contracted for the fourth consecutive month in January. Zhiwei Zhang, chief economist at Pinpoint Asset Management, expected China’s central bank to cut rates in the early quarters of 2024 to boost domestic demand. “Economic momentum remained muted as the deflationary pressure persists,” Zhang said. Weak external demand dragged down manufacturing activity as the new export orders index registered at 47.2, which marked the 10th consecutive month of contraction. According to the National Bureau of Statistics of China, the official non-manufacturing purchasing managers’ index (PMI), which includes services and construction, increased from 50.4 in December to 50.7. “It is not clear if the latest rise in the PMIs reflects a further improvement in January or simply the easing of sentiment effects that have been weighing on the surveys,” said Julian Evans-Pritchard, head of China economics at Capital Economics. “Either way, it adds to evidence that growth momentum in China is in the midst of a renewed recovery, albeit one that remains on shaky foundations and is unlikely to be sustained once current policy support is pared back,” Evans-Pritchard added.
In Japan, factory activity shrank in January as the subsiding economy at home and overseas weighed on output and new orders. The final au Jibun Bank Japan manufacturing purchasing managers’ index (PMI) increased to 48.0 but remained below the 50.0 threshold separating growth and contraction in activity. “Depressed economic conditions at home and globally weighed heavily on the sector,” said Usamah Bhatti at S&P Global Market Intelligence. While the pace of decline has slowed, the two main subindexes of the PMI, output and new orders, fell for the eighth consecutive month. Manufacturers cited higher prices of raw materials, labor, and fuel added to cost pressures. Manufacturers’ confidence remained above the series average, primarily due to hopes for improved demand in markets such as semiconductors. However, optimism ticked down from December. “Japanese manufacturers faced additional pressures on the price and supply front,” said Bhatti.
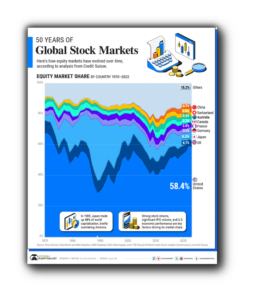
Finally: Fifty years of global stock markets, according to data from Credit Suisse, showed that the U.S. remained the world’s financial power as of the final quarter in 2022. But how long-lasting is the U.S.’ vast share of the global stock market? History suggests that the rise and fall of financial powers tend to be influenced by debt levels, economic strength, and military power. Amsterdam’s stock market, considered one of the oldest globally, predates the New York Stock Exchange by nearly two centuries, originating in 1602. By the 1700s, London began to eclipse Amsterdam as a leading financial market. Following World War II, New York surpassed London as a global financial center, a position which it continues to hold.
Japan was listed as the second largest stock market at 6.3% of the global market share. In 1989, Nikkei hit an all-time high and Japan outperformed the U.S. amid rapid economic growth. However, the interval was short lived, and it took thirty-three years for Japan’s stock market to reacquire those highs. Despite China’s status as the second-largest global economy, its share of the world’s equity market is merely 3.7%, on par with that of the UK. America’s stock market returns have outperformed nearly all other countries since 1900, which has attracted investors internationally. Furthermore, the U.S. dollar’s status as a reserve currency, alongside the depth of its financial markets, are central components for why the U.S. has sustained its influence over global stock markets.
(Sources: All index- and returns-data from Norgate Data and Commodity Systems Incorporated; news from Reuters, Barron’s, Wall St. Journal, Bloomberg.com, ft.com, guggenheimpartners.com, zerohedge.com, ritholtz.com, markit.com, financialpost.com, Eurostat, Statistics Canada, Yahoo! Finance, stocksandnews.com, marketwatch.com, visualcapitalist.com, wantchinatimes.com, BBC, 361capital.com, pensionpartners.com, cnbc.com, FactSet.) Content provided by WE Sherman and Company. Securities offered through Registered Representatives of Cambridge Investment Research Inc., a broker-dealer, member FINRA/SIPC. Advisory Services offered through Cambridge Investment Research Advisors, a Registered Investment Adviser. Strategic Investment Partners and Cambridge are not affiliated. Indices mentioned are unmanaged and cannot be invested into directly. Past performance is no guarantee of future results. These opinions of Strategic Investment Partners and not necessarily those of Cambridge Investment Research, are for informational purposes only and should not be construed or acted upon as individualized investment advice.