
1-8-2024 Weekly Market Update
The very Big Picture
The long-term valuation of the market is commonly measured by the Cyclically Adjusted Price to Earnings ratio, or “CAPE”, which smooths-out shorter-term earnings swings in order to get a longer-term assessment of market valuation. A CAPE level of 30 is considered to be the upper end of the normal range, and the level at which further PE-ratio expansion comes to a halt (meaning that further increases in market prices only occur as a general response to earnings increases, instead of rising “just because”). The market was recently above that level and has fallen back.
Of course, a “mania” could come along and drive prices higher – much higher, even – and for some years to come. Manias occur when valuation no longer seems to matter, and caution is thrown completely to the wind – as buyers rush in to buy first, and ask questions later. Two manias in the last century – the “Roaring Twenties” of the 1920s, and the “Tech Bubble” of the late 1990s – show that the sky is the limit when common sense is overcome by a blind desire to buy. But, of course, the piper must be paid, and the following decade or two were spent in Secular Bear Markets, giving most or all of the mania-gains back.
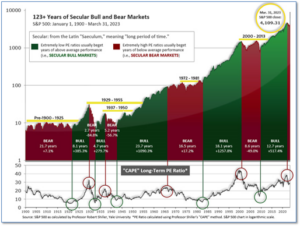
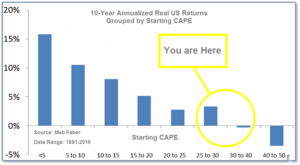
See Fig. 1 for the 100-year view of Secular Bulls and Bears. The CAPE is now at 31.78, down from the prior week’s 32.27. Since 1881, the average annual return for all ten-year periods that began with a CAPE in this range has been slightly positive to slightly negative (see Fig. 2).
Note: We do not use CAPE as an official input into our methods. However, if history is any guide – and history is typically ‘some’ kind of guide – it’s always good to simply know where we are on the historic continuum, where that may lead, and what sort of expectations one may wish to hold in order to craft an investment strategy that works in any market ‘season’ … whether the current one, or one that may be ‘coming soon’!
The Big Picture:
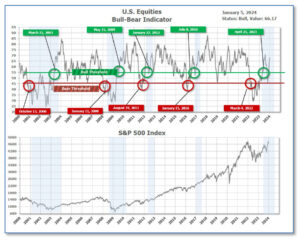
The ‘big picture’ is the (typically) years-long timeframe – the timeframe in which Cyclical Bulls and Bears operate. The U.S. Bull-Bear Indicator finished the week in Bull territory at 66.17 down from the prior week’s 68.20.(see Fig. 3)
In the Quarterly- and Shorter-term Pictures
The Quarterly-Trend Indicator based on the combination of U.S. and International Equities trend-statuses at the start of each quarter – was Positive entering January, indicating positive prospects for equities in the first quarter.
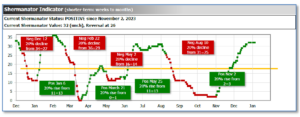
Next, the short-term(weeks to months) Indicator for US Equities turned positive on November 2, and ended the week at 32, unchanged from the prior week.
In the Markets:
U.S. Markets: Stocks gave up a fragment of their solid gains as investors seemed to have turned towards utilities, energy, consumer staples, and health care. The small-cap Russell 2000 Index had a steeper drop than the broad market and the technology-heavy Nasdaq Composite Index was weighed down by a slide in Apple shares. The Dow Jones Industrial Average shed -0.6%, closing the week at 37,466. The technology-heavy NASDAQ retreated -3.2%. By market cap, the large cap S&P 500 lost -1.5%, while the mid cap S&P 400 fell by -2.5%. The small cap Russell 2000 saw the largest drop this week at -3.7%.
International Markets: The international indexes finished the first week of 2024 to the downside as well. Canada’s TSX and the UK’s FTSE 100 ticked down -0.1% and -0.6%, respectively. France’s CAC 40 shed -1.6%, while Germany’s DAX lost -0.9%. In Asia, China’s Shanghai Composite retreated -1.5%. Japan’s Nikkei ticked down -0.3%. As grouped by Morgan Stanley Capital International, developed markets fell by -1.6%, while emerging markets gave up -1.9%.
Commodities: Precious metals finished the week negative. Gold ticked down -1.06% to $2,049.80 an ounce, while Silver retreated -3.20% to $23.32. The industrial metal copper, viewed by some analysts as a barometer of world economic health due to its wide variety of uses, fell by -2.17%. West Texas Intermediate crude oil gained 3.01% and rose to $73.81 per barrel.
U.S. Economic News: The labor market showed underlying resilience as the number of Americans who applied for unemployment benefits dropped to 202,000. Economists had forecasted new claims would total 219,000. The number of individuals receiving unemployment benefits in the U.S. declined by 31,000 to 1.85 million. However, the whole of 2023 saw a gradual rise in continuing claims, which could signify it’s taking longer for people to find new employment opportunities. Higher interest rates may have reduced the necessity for businesses to hire more workers, but companies seem to be holding onto most of their current employees. “The initial claims data are consistent with labor market conditions that are loosening but not unraveling and still characterized by relatively few layoffs,” said Nancy Vanden Houten, lead U.S. economist of Oxford Economics.
Job openings dropped in the fourth quarter to 8.8 million. According to the Labor Department, job listings declined from a revised 8.9 million in October. While openings are not always filled, the number of job postings sheds some light onto the health of the labor market. Since 2022, job openings have steadily decreased from a record of 12 million. The number of people quitting jobs declined to a 33-month low of 3.5 million. Last year, the record number was 4.5 million. Transportation and the federal government had the steepest decline in job openings, while the largest increase was in wholesale businesses. “Signs still point to steady jobs growth this year, in line with no recession,” said corporate economist at Navy Federal Credit Union, Robert Frick.
The Institute for Supply Management reported the index measuring the U.S.’ manufacturing activity climbed 0.7 percentage points to 47.4 at the end of the fourth quarter. Economists had forecasted the index would increase to 47.2. Manufacturing has been below the 50 threshold for 14 consecutive months. In December, the new-orders index fell to 47.1, a drop of 1.2 percentage points. Production increased to 50.3, an increase of 1.8 percentage points between November to December. Meanwhile, prices shed 4.7 percentage points to 45.2. Inventories ticked down 0.5 percentage points to 44.3. Sixteen industries reported contraction in December, with primary metals being the only industry to report growth. Layoffs had increased last month, primarily in the machinery, electronics, and food and beverage sectors. “The survey indicates that conditions in the factory sector remain unusually weak and that output is likely to continue declining for at least a few more months,” said Andrew Hunter, deputy chief U.S. economist at Capital Economics.
The Institute for Supply Management’s services survey dropped from 52.7% to 50.6% last month. The ISM survey found that the economy had slowed in the final quarter of 2023 but remained fairly healthy despite higher interest rates. The production gauge ticked up to 56.6%, a rise of 1.5 points. Meanwhile, the new-orders index and the employment barometer fell to 52.8% and 43.3%, respectively. The prices-paid index, which is a measure of inflation, dropped to 57.4%. “The services sector had a pullback in the rate of growth in December, attributed to the decrease in the rate of growth for new orders and contraction in employment,” said chair of the survey, Anthony Nieves. “There are concerns related to economic uncertainty, geopolitical events and labor constraints,” added Nieves.
International Economic News: In Canada, employment stagnated last month. Statistics Canada reported that the economy added just 100 jobs last month. Analysts had forecasted a net gain of 13,500 jobs and that the unemployment rate would rise from 5.8% to 5.9%. The average hourly wage growth for permanent employees accelerated from 5.0% to an annual rate of 5.7% at the end of last quarter, Statscan said. “The main story here is we are seeing some cool down in the job market,” said Doug Porter, chief economist at BMO Capital Markets. The Bank of Canada’s ten rate hikes, between 2022 and 2023, has weighed down job growth in recent months. “The stagnation in employment, which follows sluggish GDP growth last year, suggests that the impacts of high interest rates are becoming more widespread across the economy,” said Royce Mendes, head of macro strategy at Desjardins Group.
Across the Atlantic, Britain’s economy ended last quarter on more robust footing than initially believed. The final S&P Global/CIPS UK Services Purchasing Manager’s Index (PMI) rose to 53.4 in December, suggesting that businesses and households are bearing inflation and borrowing costs relatively well. Services firms saw robust growth in new orders, while export demand rose only marginally. “The further rebound in December’s PMI suggests a recession should be narrowly avoided,” said Gabriella Dickens, senior UK economist at Pantheon Macroeconomics. A separate survey by the British Chambers of Commerce showed that companies had reported higher optimism about sales growth this year. “However, many firms continued to cite challenging underlying business conditions due to the stagnating UK economy and strong pressure on margins from rising labour costs,” said Tim Moore, economics director at S&P Global Market Intelligence.
On Europe’s mainland, unemployment ticked up in Germany last month. The Federal Employment Agency said the number of people out of work increased by 5,000 in seasonally adjusted terms to a total of 2.703 million. Analysts had expected an increase of 20,000. Compared to 2022, the number of unemployed people in Germany added 191,000 to 2.6 million over the course of 2023. The agency reported there were on average 761,000 job openings, which was 84,000 less than in 2022. In a long-term comparison, demand for labor remained strong. Andrea Nahles, chairwoman of the agency, noted that 2023 had one of the lowest unemployment rates since Germany’s reunification. “The labour market is still holding up well in terms of the extent of the burdens and uncertainties,” Nahles said.
French inflation edged up last month as service prices and energy costs jumped after the government cut support for households. On a monthly basis, prices ticked up 0.1% from a negative figure in November. The acceleration in services inflation concerned policymakers, who view it as an indicator of core, domestic price pressures. The institut national de la statistique et des études économiques agency (INSEE) said it increased to 3.1% in the last month of the year, primarily due to the transport sector. “The question of how long it will be necessary to keep interest rates at the current level before reducing them will depend on the future development of the data, with uncertainty remaining high,” said Spanish central bank chief Pablo Hernandez de.
China’s services activity expanded as the number of new businesses increased, a private-sector survey showed. The Caixin/S&P Global services purchasing managers’ index (PMI) ticked up from 51.5 to 52.9 in December, which surpassed the 50-mark separating growth from contraction. The robust addition of new businesses expanded at the fastest rate since the second quarter of last year. According to the National Immigration Administration, foreign demand for Chinese services increased after the visa-free policy took effect. Approximately 214,000 travelers from France, Germany, Italy, the Netherlands, Spain, and Malaysia entered China last month. Improved demand conditions encouraged firms to increase their staffing levels to meet rising business requirements. According to Jin, a restaurant owner based in Hangzhou, “The overall number of customers rose slightly in December compared with November.”
In Japan, firms rushed to resume production after a magnitude 7.6 earthquake disrupted infrastructures in the country’s west coast. According to Industry Minister Ken Saito, approximately 80% of 200 companies with plants in the quake-hit areas have resumed production or would resume soon following the quake. Electronic parts supplier Murata Manufacturing said it was examining the damage at five plants in Ishikawa and Toyama, while eight other plants in the region have resumed production. Carmaker Toyota Motor president Koji Sato said the company was looking into how production might be impacted after its suppliers Aisin and Sumitomo Electric Industries suffered some damage from the earthquake. Nomura Securities’ Chief Economist Kyohei Morita estimated the earthquake would account for an economic loss of less than 0.01% of Japan’s gross domestic product. However, the earthquake may have affected some centers for tourism. “The damages to infrastructure and reputation of Ishikawa’s tourism sector could linger for a long time – possibly more than a decade,” said Daisuke Iijima, an analyst at Teikoku Databank.
Finally: What holds significance to you and why? As an investor, consistently assessing the value of things and predicting their future worth is a routine practice. However, what drives you to do this? While financial success is certainly valuable, it serves as a means of acquiring what you deem to be meaningful. Currencies serve as a common conduit through which we exchange things of value.
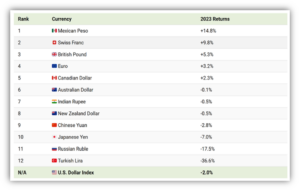
Looking back at 2023, which currencies exhibited the strongest and weakest performances? In comparison to the dollar, the Mexican peso saw an impressive appreciation of nearly 15%, making it the top-performing currency of the year. This surge can be attributed to aggressive interest rate hikes by the country’s central bank, currently standing at 11.25%. Despite the positive impact on the peso’s value, there is a potential downside as it might affect the competitiveness of the country’s exports. Across the Atlantic, the Swiss franc and British pound experienced gains of +9.8% and +5.3%, respectively. On the other hand, the Japanese yen faced a decline of -7% in 2023 but holds a more optimistic outlook for 2024. The central bank’s inclination to raise interest rates to address inflation is expected to strengthen the currency. Conversely, the Russian ruble and Turkish lira concluded the year with depreciations of -17.5% and -36.6%, respectively.
(Sources: All index- and returns-data from Norgate Data and Commodity Systems Incorporated; news from Reuters, Barron’s, Wall St. Journal, Bloomberg.com, ft.com, guggenheimpartners.com, zerohedge.com, ritholtz.com, markit.com, financialpost.com, Eurostat, Statistics Canada, Yahoo! Finance, stocksandnews.com, marketwatch.com, visualcapitalist.com, wantchinatimes.com, BBC, 361capital.com, pensionpartners.com, cnbc.com, FactSet.) Content provided by WE Sherman and Company. Securities offered through Registered Representatives of Cambridge Investment Research Inc., a broker-dealer, member FINRA/SIPC. Advisory Services offered through Cambridge Investment Research Advisors, a Registered Investment Adviser. Strategic Investment Partners and Cambridge are not affiliated. Indices mentioned are unmanaged and cannot be invested into directly. Past performance is no guarantee of future results. These opinions of Strategic Investment Partners and not necessarily those of Cambridge Investment Research, are for informational purposes only and should not be construed or acted upon as individualized investment advice.