
1-22-2024 Weekly Market Update
The very Big Picture
The long-term valuation of the market is commonly measured by the Cyclically Adjusted Price to Earnings ratio, or “CAPE”, which smooths-out shorter-term earnings swings in order to get a longer-term assessment of market valuation. A CAPE level of 30 is considered to be the upper end of the normal range, and the level at which further PE-ratio expansion comes to a halt (meaning that further increases in market prices only occur as a general response to earnings increases, instead of rising “just because”).
Of course, a “mania” could come along and drive prices higher – much higher, even – and for some years to come. Manias occur when valuation no longer seems to matter, and caution is thrown completely to the wind – as buyers rush in to buy first, and ask questions later. Two manias in the last century – the “Roaring Twenties” of the 1920s, and the “Tech Bubble” of the late 1990s – show that the sky is the limit when common sense is overcome by a blind desire to buy. But, of course, the piper must be paid, and the following decade or two were spent in Secular Bear Markets, giving most or all of the mania-gains back.
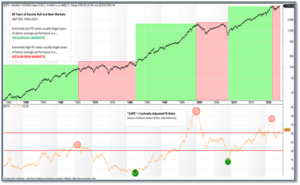
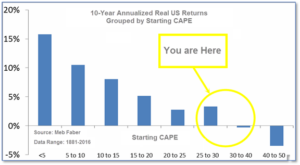
See Fig. 1 for the 100-year view of Secular Bulls and Bears. The CAPE is now at 32.57, up from the prior week’s 32.20. Since 1881, the average annual return for all ten-year periods that began with a CAPE in this range has been slightly positive to slightly negative (see Fig. 2).
Note: We do not use CAPE as an official input into our methods. However, if history is any guide – and history is typically ‘some’ kind of guide – it’s always good to simply know where we are on the historic continuum, where that may lead, and what sort of expectations one may wish to hold in order to craft an investment strategy that works in any market ‘season’ … whether the current one, or one that may be ‘coming soon’!
The Big Picture:
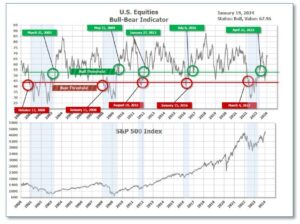
The ‘big picture’ is the (typically) years-long timeframe – the timeframe in which Cyclical Bulls and Bears operate. The U.S. Bull-Bear Indicator finished the week in Bull territory at 67.96 up from the prior week’s 66.68.(see Fig. 3)
In the Quarterly- and Shorter-term Pictures
The Quarterly-Trend Indicator based on the combination of U.S. and International Equities trend-statuses at the start of each quarter – was Positive entering January, indicating positive prospects for equities in the first quarter.
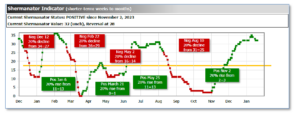
Next, the short-term(weeks to months) Indicator for US Equities turned positive on November 2, and ended the week at 32, down 2 from the prior week.
In the Markets:
U.S. Markets: Stocks moved mostly higher over the holiday-shortened week, although the advance was heavily focused in growth stocks. Information technology stocks, assisted by a rally in semiconductor shares, outperformed. In observance of the Martin Luther King Jr. holiday, markets were closed on Monday. The Dow Jones Industrial Average rose by 0.7%, closing the week at 37,864. The technology-heavy NASDAQ advanced 2.3%. By market cap, the large cap S&P 500 increased by 1.2%, while the mid cap S&P 400 rose 0.5%. The small cap Russell 2000 ended the week down -0.3%, closing at 1,944.
International Markets: The international indexes finished the week mostly down. Canada’s TSX ticked down -0.4%, while the UK’s FTSE 100 lost -2.1%. France’s CAC 40 and Germany’s DAX dropped -1.3% and -0.9%, respectively. In Asia, China’s Shanghai Composite retreated -1.7%. Japan’s Nikkei was up 1.1%, the only international index in the green this week. As grouped by Morgan Stanley Capital International, developed markets dropped -1.5%, while emerging markets gave up -2.1%.
Commodities: Precious metals finished the week mixed. Gold decreased by -1.09% to $2,029.30 an ounce. Silver retreated -2.65% to $22.71 an ounce. The industrial metal copper, viewed by some analysts as a barometer of world economic health due to its wide variety of uses, climbed 1.23%. West Texas Intermediate crude oil added 0.78% to $73.25 per barrel.
U.S. Economic News: The New York Federal Reserve’s Empire State business-conditions index, a gauge of manufacturing activity, tumbled to 43.7. Over the past two months, the index contracted 58.2 points, primarily due to a decline in new orders. The index for new orders retreated 38.1 points to -49.4. The key national ISM factory index showed the sector had contracted for 14 consecutive months. Shipments lost 24.9 points to a total of -31.3 points. In January, unfilled orders declined, delivery times shortened, and employment hours worked contracted. Historically, a large drop in the Empire State index tends to be short-lived. On the bright side, optimism about the upcoming six months has modestly increased, alongside the index for future business conditions which ticked up 7 points to 18.8. Investment plans improved this month as the capital-spending index increased 10 points to 13.7. “This outsized drop suggests January was a difficult month for New York manufacturers, with employment and hours worked also contracting,” said Richard Deitz, economic research adviser at the New York Fed.
Sales at retailers added 0.6% last month, which capped off a decent holiday-shopping season and underscored some resiliency in the U.S. economy. Economists had expected a 0.4% increase. Sales rose a solid 5.6% in 2023, indicating that Americans have persisted in their spending habits, despite elevated interest rates and inflation. In December, sales increased by 3% at department stores, 1.5% at internet retailers and clothing stores, and 1.1% at auto dealers. Receipts declined at pharmacies, home centers and gas stations, and furniture and appliance stores. Restaurant sales showed no significant change. “With a still solid labor market, lower gasoline prices, and interest rates edging lower, December retail sales reflect an economy that, although slowing, continues to be underpinned by consumer spending,” said Quincy Krosby, chief global strategist at LPL Financial.
The Federal Reserve’s Beige Book, a collection of anecdotes from business contacts, showed signs that the labor market has cooled in nearly all regions of the U.S. The contacts reported a higher number of applicants, decreased turnover rates, eased wage pressures, and more selective hiring by firms. The Fed’s survey found that businesses seemed more optimistic moving forward and that expectations were either positive, improving, or both. The survey included reports that, in response to consumers’ price sensitivity, retailers were compelled to narrow their profit margins and exert pressure on suppliers to keep prices contained. The Federal Reserve’s survey additionally observed a decline in trade volumes at Richmond ports, likely attributable to increased shipping rates. Last year, net farm income in the Chicago region was above average. However, projections for farm income in 2024 were subdued, given that prices at the beginning of the year were below break-even levels for numerous commodities.
The number of individuals who applied for unemployment benefits in mid-January fell to 187,000. Americans collecting unemployment benefits decreased by 26,000 to 1.81 million. However, a gradual rise in continuing claims throughout 2023 suggests it has required more time for people to find new jobs. The actual, or unadjusted figures, showed initial jobless claims totaled 289,228, which signified that the rate of layoffs remained low. Tuan Nguyen, U.S. economist at RSM, said “We don’t see many reasons to believe the labor market will show significant declines until the summer.”
Home builders scaled back new projects, which led to a 4.3% drop in the construction of new homes last month. Housing starts fell from 1.53 million in November to a 1.46 million annual pace, the government said. Builders decreased construction of new single-family homes, which declined by 8.6%, but apartment starts rose 7.5%. The West saw a 4.7% increase in the construction of overall housing starts, including single-family homes, townhomes, and apartments. Building permits for single-family homes added 1.9% last month. Permits for homes with two to four units, such as townhomes, advanced 10.6%. “Looking ahead to this year, we don’t think mortgage rates will fall enough to unwind mortgage rate ‘lock-in’ and cause a meaningful recovery in supply,” said Thomas Ryan, property economist at Capital Economics, in a note to clients. “Against that backdrop, demand will continue to get diverted to new builds, which will also encourage stronger construction activity,” added Ryan.
The National Association of Realtors reported home sales were down by 6.2% last month, when compared to home sales in December 2022. The median price for an existing home rose 4.4% year-on-year to $382,600 at the end of the quarter, the NAR said. Prices remained below the peak in June 2022, when the median price of a resale home reached $413,800. The total number of homes for sale increased by 4.2% from last year, to 1 million units. Homes listed for sale remained on the market for 29 days on average, which was above November’s average. Across America, sales of existing homes were mixed. Sales rose most notably in the West, by 7.8%. The median price of a home in that region was $582,000. “Mortgage rates are meaningfully lower compared to just two months ago, and more inventory is expected to appear on the market in upcoming months,” said Lawrence Yun, chief economist at the NAR. “The bad news is that home affordability is not likely to improve for potential homebuyers, so those looking to buy a home should make an offer before the spring home buying season starts,” Selma Hepp, chief economist at CoreLogic, said in a statement.
International Economic News: Canada’s annual inflation rate rose from 3.1% in November to 3.4% last month, Statistics Canada said. The three-month annualized rate of the Bank of Canada’s two core measures of underlying inflation, CPI-trim and CPI-median, rose to 3.6% from an upwardly revised 2.9% in the prior month, according to Royce Mendes, head of macro strategy for Desjardins Group. The annual inflation rate was primarily driven by increased gasoline prices, Statscan said. Airfares, fuel oil, passenger vehicles and rent accelerated as well. Food purchases gained 4.7% year-on-year. The acceleration of core inflation “speaks to the fact that the Bank of Canada still has some progress that they need to see in order to consider lowering interest rates,” said Andrew Kelvin, chief Canada strategist at TD Securities.
Across the Atlantic, Britain’s annual rate of consumer price inflation increased to 4.0% last month. Britain’s Office for National Statistics said a rise in tobacco duty, which took effect in late November, augmented inflation in December and added nearly 0.1 percentage points to consumer price inflation. Air travel added more to the consumer price inflation rate, while clothing and entertainment prices added upward pressures as well. Finance minister Jeremy Hunt said, “We took difficult decisions to control borrowing and are now turning a corner.” Core inflation was unchanged at 5.1% in December. Services inflation increased to 6.4%, whereas inflation for goods dropped to 1.9%. “The bigger picture is that inflation is falling more sharply overall than the Bank of England had expected a few months ago,” said former Bank of England policymaker, Michael Saunders. “Their thoughts will be starting to turn towards interest rates possibly coming down later this year … perhaps starting around the middle of the year,” Saunders added.
On Europe’s mainland, Germany’s Bundesverband der Deutschen Industrie association said it expects the country’s economy would grow 0.3% this year, while forecasting an expansion of 2.9% in the global economy. “The economy is at a standstill in Germany. Compared to most other major industrialised countries, our country is falling further behind,” said BDI president Siegfried Russwurm. “We don’t see any chance of a rapid recovery in 2024,” Russwurm added. The federal statistics office reported the German economy contracted by 0.3% last year due to high energy prices, inflation, and weak foreign demand. Russwurm said the modest growth expected in 2024 is set to come from a recovery in consumption as inflation eases. The Bundesverband der Deutschen Industrie association forecasted that German industry is unlikely to bounce back and production in energy-intensive sectors is likely to remain weak due to high electricity prices.
In China, the country’s economy grew 5.2% last year, which was slightly above the official target. According to data from the National Bureau of Statistics, China’s gross domestic product accelerated from 4.9% in the third quarter to 5.2% in the final quarter of 2023 but came in slightly below what economists had forecasted. On a quarter-by-quarter basis, GDP slowed from a 1.5% gain in the previous quarter to 1.0% growth. “The recovery from COVID — disappointing as it was — is over,” according to China Beige Book International’s latest survey. “At present, our country’s government debt level and inflation rate are both low, and the policy toolbox is constantly being enriched,” head of the National Bureau of Statistics, Kang Yi, said. “Fiscal, monetary and other policies have relatively large room for maneuvering, and there are conditions and space for intensifying the implementation of macro policies,” Kang added.
Japan’s core consumer price index rose 2.3% year-on-year in December but marked the slowest pace of increase since June 2022. It followed a 2.5% rise in November. The deceleration was primarily a result of a 11.6% decrease in energy prices, influenced by the base effect of the government subsidies intended to curb gasoline and utility bills last year. “Japan’s economy isn’t in very good shape with weak signs seen in consumption and capital expenditure. But that doesn’t seem to be affecting companies’ wage-hike momentum,” said former top BOJ economist Seisaku Kameda. “We’ll likely see fairly strong pay rises in this year’s annual wage negotiations,” Kameda added. He expects the bank of Japan to end negative rates at the beginning of the second quarter of this year.
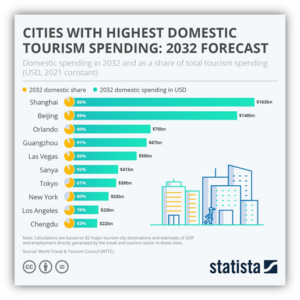
Finally: Thinking of travel plans this year? A study conducted by the World Travel and Tourism Council forecasted Shanghai to draw 88% of the city’s tourism revenue from domestic spending in China by 2032. This would equate to USD $163 billion in domestic spending. And it’s not just Shanghai; cities like Beijing ($148 billion), Guangzhou ($67 billion), Sanya ($41 billion), and Chengdu ($22 billion) are also hotspots, which may reflect China’s vastness, population, and an expanding middle class with more money for travel. In America, the top cities in the 2032 forecast were Orlando ($70 billion), Las Vegas ($58 billion), and New York ($33 billion), and Los Angeles ($23 billion).
(Sources: All index- and returns-data from Norgate Data and Commodity Systems Incorporated; news from Reuters, Barron’s, Wall St. Journal, Bloomberg.com, ft.com, guggenheimpartners.com, zerohedge.com, ritholtz.com, markit.com, financialpost.com, Eurostat, Statistics Canada, Yahoo! Finance, stocksandnews.com, marketwatch.com, visualcapitalist.com, wantchinatimes.com, BBC, 361capital.com, pensionpartners.com, cnbc.com, FactSet.) Content provided by WE Sherman and Company. Securities offered through Registered Representatives of Cambridge Investment Research Inc., a broker-dealer, member FINRA/SIPC. Advisory Services offered through Cambridge Investment Research Advisors, a Registered Investment Adviser. Strategic Investment Partners and Cambridge are not affiliated. Indices mentioned are unmanaged and cannot be invested into directly. Past performance is no guarantee of future results. These opinions of Strategic Investment Partners and not necessarily those of Cambridge Investment Research, are for informational purposes only and should not be construed or acted upon as individualized investment advice.