
3-19-18 Market Update
3-19-2018 Weekly Market Update
The very big picture:
In the “decades” timeframe, the current Secular Bull Market could turn out to be among the shorter Secular Bull markets on record. This is because of the long-term valuation of the market which, after only eight years, has reached the upper end of its normal range.
The long-term valuation of the market is commonly measured by the Cyclically Adjusted Price to Earnings ratio, or “CAPE”, which smooths out shorter-term earnings swings in order to get a longer-term assessment of market valuation. A CAPE level of 30 is considered to be the upper end of the normal range, and the level at which further PE-ratio expansion comes to a halt (meaning that increases in market prices only occur in a general response to earnings increases, instead of rising “just because”).
Of course, a “mania” could come along and drive prices higher – much higher, even – and for some years to come. Manias occur when valuation no longer seems to matter, and caution is thrown completely to the wind as buyers rush in to buy first and ask questions later. Two manias in the last century – the 1920’s “Roaring Twenties” and the 1990’s “Tech Bubble” – show that the sky is the limit when common sense is overcome by a blind desire to buy. But, of course, the piper must be paid and the following decade or two are spent in Secular Bear Markets, giving most or all of the mania gains back.
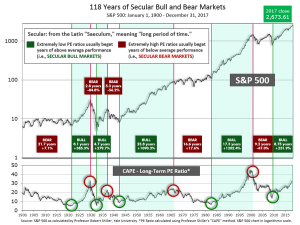
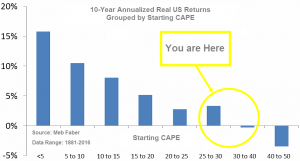
See Fig. 1 for the 100-year view of Secular Bulls and Bears. The CAPE is now at 33.10, down from the prior week’s 33.71, and still exceeds the level reached at the pre-crash high in October 2007. This value is in the lower end of the “mania” range. Since 1881, the average annual return for all ten year periods that began with a CAPE around this level have been in the 0% – 3%/yr. range. (see Fig. 2).
In the big picture:
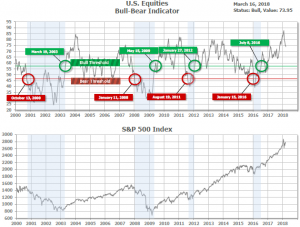
The “big picture” is the months-to-years timeframe – the timeframe in which Cyclical Bulls and Bears operate. The U.S. Bull-Bear Indicator (see Fig. 3) is in Cyclical Bull territory at 73.95, down from the prior week’s 75.20.
In the intermediate and Shorter-term picture:
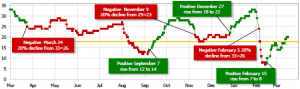
The Shorter-term (weeks to months) Indicator (see Fig. 4) turned positive on February 15th. The indicator ended the week at 20, up from the prior week’s 17. Separately, the Intermediate-term Quarterly Trend Indicator – based on domestic and international stock trend status at the start of each quarter – was positive entering January, indicating positive prospects for equities in the first quarter of 2018.
Timeframe summary:
In the Secular (years to decades) timeframe (Figs. 1 & 2), the long-term valuation of the market is simply too high to sustain rip-roaring multi-year returns – but the market has entered the low end of the “mania” range, and all bets are off in a mania. The only thing certain in a mania is that it will end badly…someday. The Bull-Bear Indicator (months to years) is positive (Fig. 3), indicating a potential uptrend in the longer timeframe. In the intermediate timeframe, the Quarterly Trend Indicator (months to quarters) is positive for Q1, and the shorter (weeks to months) timeframe (Fig. 4) is positive. Therefore, with internal unanimity expressed by all three indicators being positive, the U.S. equity markets are rated as Positive.
In the markets:
U.S. Markets: U.S. stocks fell modestly for the week, with a rally on Friday putting an end to a four-day losing streak for the large cap S&P 500. The Dow Jones Industrial Average gave back some of last week’s gains, falling ‑1.5%, or 389 points to close at 24,946. The technology-heavy NASDAQ Composite fell a lesser 1%, ending the week at 7,482. By market cap, large caps pulled back more than their smaller cap brethren. The large cap S&P 500 index gave up -1.2%, while the mid cap S&P 400 and small cap Russell 2000 each fell -0.7%.
International Markets: Canada’s TSX rose 0.86% for its second week of gains. Across the Atlantic, the United Kingdom’s FTSE retraced some of last week’s gain, ending down -0.8%. On Europe’s mainland, France’s CAC 40 managed a slight 0.16% rise, while Germany’s DAX rose 0.35%. In Asia, China’s Shanghai Composite erased almost all of last week’s gain falling -1.1%. Japan’s Nikkei and Hong Kong’s Hang Seng both finished the week up, 1% and 1.6%, respectively. As grouped by Morgan Stanley Capital International, developed markets slipped -0.44%, while emerging markets fell -1.1%.
Commodities: Precious metals lost some of their luster as Gold retraced 0.9% or -$11.70 to close at $1312.30 an ounce. Silver, which usually trades similarly to Gold but with more volatility, fell 2% to close at $16.27 an ounce. The industrial metal copper, seen by some analysts as an indicator of global economic health due to its variety of uses, retreated -0.9%. In energy, crude oil had its second week of gains. West Texas Intermediate crude oil rose $0.37 to close at $62.41 a barrel, a gain of 0.6%. Similarly, Brent crude oil ended the week up 0.78% to close at $66 per barrel.
U.S. Economic News: The number of Americans seeking new unemployment benefits fell slightly last week, remaining near a 50-year low. The Labor Department reported initial jobless claims declined by 4,000 to 226,000, well within the key 300,000 threshold that analysts use to indicate a “healthy” jobs market. Last week was the 158th consecutive week that claims remained below that level. Even more encouraging is the unemployment rate, which sits at a 17-year low of 4.1% and is likely to drop even lower in the coming months. Federal Reserve officials consider the labor market to be near or even a little beyond “full employment”. Continuing claims, which counts the number of people already receiving benefits, rose by 4,000 to 1.88 million. Continuing claims dropped below 2 million last spring and have remained there ever since.
The number of U.S. job openings surged to a record 6.3 million in January, according to the Labor Department. The reading shows that businesses are still actively adding staff nine years into an economic expansion that appears to still have plenty of momentum. White collar and professional firms posted the most job openings, along with delivery services and utilities. Companies are still hiring despite the continued shortage of skilled labor. In the details of the report, the closely watched “quits rate” remained unchanged at 2.5% among private-sector employees. It is widely believed that the Federal Reserve closely watches the quits rate as a barometer of labor market health, believing that the majority of employees who quit are doing so because they believe even better opportunities exist elsewhere.
Confidence among the nation’s home-builders dropped for the third month in a row, according to the National Association of Home Builders (NAHB). The NAHB’s monthly confidence gauge dropped a point to a reading of 70 for March, missing economists’ expectations of an unchanged reading of 72. In the details of the report, the sub-gauge of current sales conditions was unchanged at 77, but the index of buyer traffic fell by 3 points to 51, and the measure of expected sales over the next six months slipped 2 points to 78. Overall, however, the report was still quite strong. Readings over 50 indicate improving conditions, while readings over 70 are considered very strong. In its statement, the NAHB said, “Builders’ optimism continues to be fueled by growing consumer demand for housing and confidence in the market,” and pointed only to the difficulty of finding buildable lots as a headwind.
The number of new homes under construction fell more than expected last month. Housing starts declined 7.0% to a seasonally-adjusted annual rate of 1.236 million units, according to the Commerce Department. A plunge in the construction of multi-family housing units, such as apartments, offset a second straight monthly increase in single-family homes. The report wasn’t as bad as the headline number suggests, considering that construction of single-family homes – which account for 70% of all new residential construction – was up. Permits for future building activity decreased 5.7% to a rate of 1.298 million units in February. They are still sharply higher when compared to the same time last year, however. In the details, housing starts fell in the South, Midwest, and West, but rose in the Northeast.
Sentiment among the nation’s small business owners continues to surge towards the peak reached during Ronald Reagan’s presidency. The National Federation of Independent Businesses (NFIB) small-business optimism index rose 0.7 point last month to 107.6, its second-highest reading in its history. The index of sentiment among small-business owners has soared ever since President Trump’s tax cuts were announced. In its release the NFIB stated, “The small business sector is very encouraged by the economic policies of the administration and the strength of the economy, willing to invest more and hire more if workers can be found to fill their open positions.” Notably, for the first time in 12 years taxes received the fewest votes as owners’ number one business problem. Their biggest problem continues to be a lack of qualified workers to fill open positions.
The mood among the nation’s consumers surged to a 14-year high in March, according to the University of Michigan’s consumer sentiment index. The index rose 2.3 points to 102, its highest level since 2004 and topping economists’ forecasts of 99.5. Notably, all of the index’s gains were driven by households with incomes in the bottom third of the survey. Tax reform was mentioned as supporting consumers’ moods while negative views of the recent tariffs on steel and aluminum weighed. Overall, consumers continued to express confidence about both buying and borrowing due to the expected improving trends. The index measures the attitudes of 500 consumers on future economic prospects in areas such as personal finances, inflation, unemployment, government policies and interest rates.
According to the Bureau of Labor Statistics, inflation at the consumer level rose just 0.2% last month, down from the 0.5% surge in January. Continued rising costs for housing, clothes, and auto insurance all contributed to the increase. On an annualized basis, the CPI ticked up 0.1% to 2.2%. Stripping out the often volatile gas and food categories, the more closely watched core rate of inflation also rose 0.2%. The 12-month rate of core inflation remained unchanged at 1.8% for the third month in a row. Helping to keep inflation in check was a 0.5% drop in the cost of new cars and trucks, the biggest decline in 9 years. Analysts are keeping a close eye on inflation measures this year to get an indication of the likely response of the Federal Reserve. For now, the Fed is anticipating three rate increases, but if inflation continues to rise the central bank could act more aggressively.
At the wholesale level, costs for the nation’s producers increased a bit more than expected as a rise in the cost of services offset a decline in the price of goods. The Labor Department reported its producer price index (PPI) for final demand rose 0.2% last month, following a 0.4% increase in January. Economists had predicted only a 0.1% increase last month. On an annualized basis, the PPI rose 2.8%, a 0.1% increase over January, but still below the recent peak of 3.1%. Most of the increase came from a rise in the cost of services such as lodging, passenger flights, and telecommunications. Stripping out energy, food, and trade margins, wholesale inflation rose a stronger 0.4%.
Sales at the nation’s retailers fell last month for the third month in a row, according to the Commerce Department. However, the decline was just 0.1% and not likely a sign of trouble for the broader economy. Economists had expected a 0.3% increase in sales. The decline in retail sales was predominantly due to a 0.9% decrease in purchases of motor vehicles and other big-ticket items. On the positive side, however, internet retailers, home centers, apparel stores, and sporting goods retailers all posted higher sales. Core retail sales, which exclude automobiles, gasoline, building materials, and food services, rose 0.1% after being unchanged in January.
Two reports on manufacturing from Federal Reserve regional banks showed that manufacturers continued to report brisk activity this month. In Philadelphia, the Philly Fed’s manufacturing index slipped 3.5 points to a reading of 22.3, however in New York, the New York Fed’s Empire State index surged almost 10 points to a reading of 22.5. Economists had only expected a reading of 15 for the Empire State index. Both gauges are well above the zero line that indicates improving conditions. In Philadelphia, the sub-index readings were much stronger than the headline number with the new orders sub-index and shipments sub-index surging 11.2 points and 16.9 points respectively. In New York, the shipments sub-index jumped 14.5 points. Head of research at Contingent Macro Research J. Connelly stated, “Manufacturers across the mid-Atlantic and the New York region remain very positive about their outlooks for business. With strong new order growth, the only concern is that both surveys continue to suggest a moderate acceleration in input prices.”
International Economic News: Home sales in Canada declined last month amid higher interest rates and new mortgage-financing rules. The Canadian Real Estate Association, which represents the country’s real-estate agents, said sales activity across Canada in February dropped 6.5% from the previous month on a seasonally adjusted basis, marking a second straight monthly decline. On an annualized basis, sales fell 16.9% in February on an actual, or not seasonally adjusted, basis. Sales activity declined in 80% in all local markets in February compared with the same month last year, the association said. Gregory Klump, CREA’s chief economist, said in its statement, the drop in sales activity “confirms that many home buyers moved purchase decisions forward late last year before tighter mortgage rules took effect in January.” The latest regulation requires all prospective buyers to undergo a so-called “stress test” before a bank can issue a loan.
The Bank of England (BOE) warned that Brexit poses “material risks” to the United Kingdom’s financial system despite efforts to ease the disruption. The bank’s Financial Policy Committee said that while “progress has been made”, further action was needed in areas where the UK and European Union needed to make joint commitments. The BOE has previously noted that to preserve the continuity of existing cross-border insurance and derivatives contracts, UK and EU legislation would be required. The bank estimates that approximately £26 trillion could be affected. On a global scale, the committee said interest rate volatility, US corporate debt and vulnerabilities in China’s financial system all presented risks to the UK economic system.
The Bank of France raised its growth and inflation forecasts saying it expected a strong rebound in French exports this year. In its March forecasts, France’s central bank raised its 2018 economic growth forecast by 0.2% to 1.9%. In addition, it expects inflation to reach 1.6% this year. The Bank of France’s bullish forecasts underscore the recent strengthening of the French economy. Strong business investment at the end of last year helped push economic growth to 2% last year, and business surveys in early 2018 indicate activity is more robust than expected.
In Germany, the DIW Institute raised its growth forecast for Europe’s largest economy to 2.4%. The economic institute cited measures planned by the new coalition government to reduce the financial burden on households. DIW also noted that trade barriers were the main risk for Germany’s economy, which continues to be export-oriented. The German Economy Ministry noted that U.S. import tariffs on metals should have a “limited effect” on the global recovery, but any escalation into a full-blown trade war and its related uncertainty could cause tangible damage to the German economy.
A new report released by the Information Technology and Innovation Foundation (ITIF), an international technology policy trade group, any Trump administration plan that would levy a 25% tariff on China’s information and communications technology imports would lead to billions in losses for the U.S. economy. According to the report, a 25% tariff would cost the U.S. economy $332 billion over the next 10 years, while a tariff of 10% would add up to $163 billion. ITIF Vice President Stephen Ezell stated, “The Trump administration’s goals of confronting unfair Chinese trade practices and reinvigorating U.S. manufacturing are commendable, but we need to ensure that any penalties on China’s trade actions are not penalties on the U.S. economy.”
Japan’s economy will likely grow 1.5% this year, before slowing to 1.1% growth in 2019, the Organization for Economic Cooperation and Development (OECD) stated. The latest reading was an improvement from the Paris-based organization’s earlier forecast of 1.2%. Despite the upward revision, the OECD said private consumption in Japan could be subdued if wage and income growth are modest. Slow wage growth continues to pose a challenge to policymakers trying to push inflation in Japan up to the Bank of Japan’s 2% growth target.
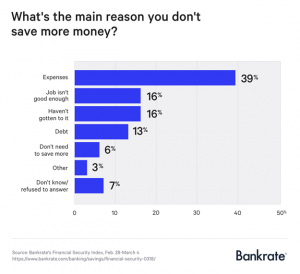
Finally: Do you have at least $10,000 saved for retirement? If so, congratulations, you’ve managed to put away more than 40% of all working-age Americans. A recent survey from Bankrate.com found that despite the brisk jobs market and increasing wages, Americans still aren’t saving much. Only 16% of survey respondents stated they saved at least the recommended 15% of their earnings, while 40% report saving none to just 5%. Mark Hamrick, senior economic analyst at Bankrate stated that while the economy might be prospering now, it won’t last forever. “With a steady, significant share of the working population saving nothing or relatively little, it’s virtually guaranteed that they’ll be unable to afford a modest emergency expense or finance retirement,” Hamrick said. The main reason American’s aren’t saving? Expenses. It seems obvious that “Expenses” would be a prime reason for not saving among those on the lower rungs of the income ladder, but shockingly, “Expenses” is also the biggest reason why members of the upper middle class don’t save enough as well. These folks live beyond their means in McMansions, take hugely expensive frequent vacations, eat out too often and drive unnecessarily fancy automobiles. Bankrate’s blunt advice: downsize your house, sell the cars, stay home more often and – most importantly – live below your means so that there’s always something left over to save.
(sources: all index return data from Yahoo Finance; Reuters, Barron’s, Wall St Journal, Bloomberg.com, ft.com, guggenheimpartners.com, zerohedge.com, ritholtz.com, markit.com, financialpost.com, Eurostat, Statistics Canada, Yahoo! Finance, stocksandnews.com, marketwatch.com, wantchinatimes.com, BBC, 361capital.com, pensionpartners.com, cnbc.com, FactSet)
Indices mentioned are unmanaged and cannot be invested into directly. Past performance is no guarantee of future results. All Investing involves risk. Depending on the types of investments, there may be varying degrees of risk. Investors should be prepared to bear loss, including total loss of principal.