
3-5-2018 Market Update
3-5-18 Weekly Market Update
The very big picture:
In the “decades” timeframe, the current Secular Bull Market could turn out to be among the shorter Secular Bull markets on record. This is because of the long-term valuation of the market which, after only eight years, has reached the upper end of its normal range.
The long-term valuation of the market is commonly measured by the Cyclically Adjusted Price to Earnings ratio, or “CAPE”, which smooths out shorter-term earnings swings in order to get a longer-term assessment of market valuation. A CAPE level of 30 is considered to be the upper end of the normal range, and the level at which further PE-ratio expansion comes to a halt (meaning that increases in market prices only occur in a general response to earnings increases, instead of rising “just because”).
Of course, a “mania” could come along and drive prices higher – much higher, even – and for some years to come. Manias occur when valuation no longer seems to matter, and caution is thrown completely to the wind as buyers rush in to buy first and ask questions later. Two manias in the last century – the 1920’s “Roaring Twenties” and the 1990’s “Tech Bubble” – show that the sky is the limit when common sense is overcome by a blind desire to buy. But, of course, the piper must be paid and the following decade or two are spent in Secular Bear Markets, giving most or all of the mania gains back.
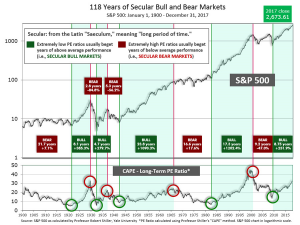
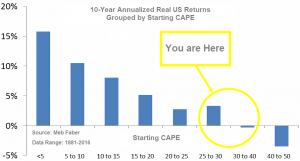
See Fig. 1 for the 100-year view of Secular Bulls and Bears. The CAPE is now at 32.56, down from the prior week’s 33.25, and still exceeds the level reached at the pre-crash high in October 2007. This value is in the lower end of the “mania” range. Since 1881, the average annual return for all ten year periods that began with a CAPE around this level has been in the 0% – 3%/yr. range. (see Fig. 2).
In the big picture:
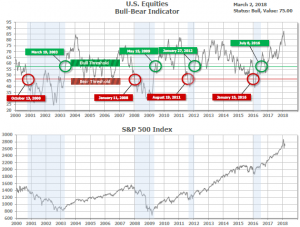
The “big picture” is the months-to-years timeframe – the timeframe in which Cyclical Bulls and Bears operate. The U.S. Bull-Bear Indicator (see Fig. 3) is in Cyclical Bull territory at 75.00, down from the prior week’s 77.65.
In the intermediate and Shorter-term picture:
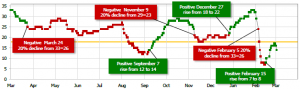
The Shorter-term (weeks to months) Indicator (see Fig. 4) turned positive on February 15th. The indicator ended the week at 14, down from the prior week’s 16. Separately, the Intermediate-term Quarterly Trend Indicator – based on domestic and international stock trend status at the start of each quarter – was positive entering January, indicating positive prospects for equities in the first quarter of 2018.
Timeframe summary:
In the Secular (years to decades) timeframe (Figs. 1 & 2), the long-term valuation of the market is simply too high to sustain rip-roaring multi-year returns – but the market has entered the low end of the “mania” range, and all bets are off in a mania. The only thing certain in a mania is that it will end badly…someday. The Bull-Bear Indicator (months to years) is positive (Fig. 3), indicating a potential uptrend in the longer timeframe. In the intermediate timeframe, the Quarterly Trend Indicator (months to quarters) is positive for Q1, and the shorter (weeks to months) timeframe (Fig. 4) is positive. Therefore, with internal unanimity expressed by all three indicators being positive, the U.S. equity markets are rated as Positive.
In the markets:
U.S. Markets: U.S. stocks were down sharply last week, closing out the month of February to the downside and marking the first monthly loss for the U.S. stock market since October 2016. Volatility remained high, with four of the five trading days exceeding 1% moves. The Dow Jones Industrial Average lost 771 points last week to end the week at 24,538, down -3.1%. The technology-heavy Nasdaq Composite retreated 80 points closing at 7,257, a loss of -1.1%. By market cap, smaller caps outperformed large caps with the mid-cap S&P 400 off -1.4% and the small-cap Russell 2000 down -1.0%, while the large-cap S&P 500 gave up -2.0%.
International Markets: Canada’s TSX gave up last week’s gains and then some by falling -1.6%. Across the Atlantic, major markets were deep in the red. The United Kingdom’s FTSE fell -2.4%, while on Europe’s mainland, France’s CAC 40 dropped -3.4%, and Germany’s DAX plunged -4.6%. Italy’s Milan FTSE plunged -3.4%. In Asia, China’s Shanghai Composite gave up just -1.1%, compared to Japan’s Nikkei which fell -3.3%. Hong Kong’s Hang Seng finished the week down -2.2%. As grouped by Morgan Stanley Capital International, developed markets fell -2.7%, while emerging markets fell -3.2%.
Commodities: While not giving a positive return, precious metals did provide some protection from the global sell-off this week. Gold fell half a percent to close at $1323.40 an ounce, while Silver was off just -0.1% ending the week at $16.47 an ounce. In energy, oil also dropped -$2.30 to $61.25 per barrel of West Texas Intermediate crude oil. Copper, seen as a proxy indicator of global economic health due to its variety of uses, sold off for a second week, down -2.7%.
February Summary: For the month of February, the Dow Jones Industrial Average gave up -4.3%, while the Nasdaq Composite gave up much less, at -1.9%. For the month, large caps outperformed their smaller cap brethren. The S&P 500 large-cap index returned -3.9%, while mid caps were down -4.6%, and small caps lost ‑4.0%. Canada’s TSX returned -3.2%, while the United Kingdom’s FTSE gave up -4%. On Europe’s mainland, France’s CAC 40 lost -3%, Germany’s DAX plunged -5.7%, and Italy’s Milan FTSE lost -3.8%. In Asia, China’s Shanghai Composite plummeted -6.4% (the worst among global major markets), while Japan’s Nikkei fell -4.5% and Hong Kong’s Hang Seng lost ‑6.2%. As grouped by Morgan Stanley Capital International, developed markets fell -4.8%, and emerging markets fell ‑5.9%. Among commodities, Gold returned -0.86% while Silver fell a lesser ‑0.6%. Copper finished the month down -2.1%, and Crude oil lost -5.0%.
U.S. Economic News: Initial claims for new unemployment benefits fell to their lowest level since the late-60’s last week, according to the Labor Department. Initial claims fell by 10,000 to 210,000, lower than economists’ estimates of 226,000. Companies continue to be reluctant to lay off workers due to difficulty finding skilled replacements. The less-volatile monthly average of claims fell by 5,000 to 220,500. That number also hit its lowest level since 1969. Continuing claims, which counts the number of people already receiving benefits, increased by 57,000 to 1.93 million. Overall, the unemployment rate stands at a 17-year low of 4.1% and nationwide data shows companies have millions of jobs open – and difficulty filling them.
Sales of newly constructed homes collapsed in January, running at a seasonally adjusted annual rate of just 593,000, a whopping 7.8% lower than December’s reading. Economists had expected sales at a 648,000 annual rate. At the current rate of sales, there is a 6.1 month supply of new homes available on the market—a sign of a well-stocked housing market. The median sales price in January was $323,000, up 2.4% from the same time last year. Analysts were quick to dismiss this somewhat bearish reading, however. Thomas Simons, senior money market economist at Jefferies stated, “It is hard to put a lot of stock in a January housing number due to the seasonal lack of activity, so we do not view today’s disappointing selling rate as an indication that the housing market is taking a turn for the worse. We will see better activity as the spring approaches.”
Pending home sales – the number of homes under contract but not yet closed – tumbled to a 3-year low, according to the National Association of Realtors (NAR). Pending home sales fell 4.7% to 104.6 in January— it’s lowest reading since October 2014. The NAR’s index of pending home sales had been grinding higher, but December’s reading was revised down and now the latest reading puts the index 3.8% below the same time last year. Contract signings generally lead actual sales by 45 to 60 days so the latest figures don’t bode well for February’s sales data or the economy in general. Throughout 2017, sales were up only 1.1% compared to 2016. Realtors now expect the recent tax-law changes affecting the deductibility of property taxes and mortgage interest to negatively affect home sales in 2018. All regions of the country had declines with the Northeast suffering the steepest decline—down 9%.
Homes prices continued to rise across the nation according to the latest reading of the S&P/Case-Shiller National Home Price Index. The index for December 2017 showed that home prices rose 0.7% in the final quarter of last year and 6.3% for the whole year. The more narrowly focused 20-city index also rose 6.3% for the year. In the details, the West still has the hottest housing markets with Seattle, Las Vegas, and San Francisco all showing the strongest price gains. Seattle’s home prices are now 24% higher than they were at the height of the last housing bubble! Even after accounting for inflation, none of the cities measured in the 20-city index saw prices fall last year. The 20-city index is just 1% shy of its peak of 2006, while the national index is 6.3% higher.
Consumer spending in January rose just 0.2% as Americans cut back following the holiday spending binge, according to the Bureau of Economic Analysis. However, analysts were more focused on the 0.4% 1-month rise in incomes, their best gain since 2012. The combination of higher incomes and slower spending boosted the U.S. savings rate 0.7% to 3.2%. The closely-watched Personal Consumption Expenditures (PCE) inflation index surged 0.4%. The PCE index is the Federal Reserve’s preferred gauge of inflation and the index is thought to dictate how many times the Fed may raise interest rates in 2018. The annual increase in the PCE remained at 1.7% for its third consecutive month, while the 12-month increase in “core” inflation was at 1.5% for the fourth straight month.
Sentiment among the nation’s consumers was the second highest in 14-years, according to the University of Michigan’s consumer sentiment index. The reading of 99.7 came on the heels of consumers’ more favorable assessments of jobs, wages, and higher after-tax pay, the University said. Of note, the highest proportion of households since 1998 reported that their finances had improved compared with a year ago. The survey measures 500 consumers’ attitudes on future economic prospects, in areas such as personal finances, inflation, unemployment, government policies and interest rates.
Orders for goods expected to last longer than three years, or so-called “durable goods”, fell -3.7% in January, according to the Commerce Department. It was their biggest decline since last summer and significantly worse than the -2.0% drop expected. The drop was attributed to a sharp reduction in orders for new passenger aircraft, which fell -28% following a 16% rise in December. Orders for non-defense capital goods excluding aircraft, looked at as a proxy for business spending plans, dropped -0.2% after declining -0.6% in December. It was the first back-to-back drop in core capital goods orders since May 2016. Jennifer Lee, senior economist at BMO Capital Markets in Toronto said, “It is early but it’s shaping up to be a soft start to 2018.”
The Institute for Supply Management’s (ISM) gauge of manufacturing activity hit a 13-year high in February rising 1.7 points to 60.8. Economists had expected a reading of 59. In the details, the new orders and production components of the ISM index fell slightly, but remained strong, while the employment index surged 5.5 points to 59.7. Some analysts view the recovery in energy prices, increase in auto sales, and global economic strength as reasons for the increase. Separately, IHS Markit’s Purchasing Managers Index (PMI) ticked down to 55.3 from January’s near a 3-year high.
New Fed Chair Jerome Powell testified in front of the House Financial Services Committee this week and painted an optimistic picture of the U.S. economy, signaling that he will continue to support the viewpoint of ongoing robust economic growth. Powell said that the jobs market and business investment continue to strengthen and that the headwinds that inhibited economic growth before have now become tailwinds. Powell emphasized that he plans to continue the policies of his predecessor who embarked on a gradual interest rate hike campaign while still encouraging broad economic growth. The Fed “will continue to strike a balance between avoiding an overheated economy” and allowing inflation to tick up toward the Federal Reserve’s 2 percent target, Powell said. “Further gradual increase in the federal funds rate will best promote attainment of both of our objectives,” he added.
The annual rate of growth in the U.S. downticked slightly more than initially forecast in the final quarter of last year according to the latest data from the Commerce Department. U.S. economic growth expanded at a 2.5% annual rate instead of the previously reported 2.6% in its second GDP estimate. The downward revision was largely due to a smaller inventory build than previously reported. Analysts noted that first quarter growth tends to be weak historically, but they expected growth to accelerate for the rest of the year as the stimulus from the $1.5 trillion tax cut package and increased government spending kicks in. Overall, the economy grew 2.3% last year, a great improvement over the 1.5% recorded in 2016.
International Economic News: The Canadian economy expanded at 1.7% in the final quarter of last year, according to Statistics Canada. The agency’s latest numbers for gross domestic product showed the economy grew at 3% last year—much stronger than the 1.4% growth seen in 2016. In the details, growth in the fourth quarter was driven by a 2.3% increase in business investment from the previous quarter, and a 0.5% rise in household spending. BMO chief economist Douglas Porter said in a note to clients the solid fourth quarter report’s main message was that the robust growth in the middle of 2016 until the middle of 2017 is now “truly in the past” and the “economy is back to the drudgery of slogging out something closer to potential of around 2%”.
Britain is now, for the first time since 2001, running a current budget surplus as tax revenues are enough to cover all day to day spending. The Office for National Statistics reported the surplus, which excludes capital investment by the government, came in at 3.8 billion pounds for 2017. Chancellor George Osborne set this as a target in 2010 and hoped to achieve it by 2015. The International Monetary Fund stated Britain set an example for other countries to follow by slashing its deficit and cutting public spending, rather than raising taxes. “Following the financial crisis, the two countries that adopted spending-based austerity and did better than the rest of the sample were Ireland and the UK,” said economists in the IMF’s Finance and Development publication.
French President Emmanuel Macron’s popularity has plummeted as he continues to push ahead with ambitious labor reform plans that threaten to ignite a wave of rolling strikes that could cripple France’s transportation network. Macron’s approval has fallen below 50% for the second month in a row as his government works to reform the debt-ridden state-owned SNCF rail company. The poll, conducted by BVA, showed only 43% of French people held a “favorable” opinion of their president last month, down 4% from January. The plunge in popularity appears to be due to his use of executive decrees to bypass parliamentary debate—a move which some respondents described as a “denial of democracy”.
German unemployment fell to an all-time low this week as the economic boom continued in Europe’s biggest economy. The number of people without work fell by 25,000 in February, driving the unemployment rate down to 5.7% according to the German Federal Labor Agency. Agency chief Detlef Scheele said that “good labor market developments” had continued with companies increasing their permanent job offers and continued to look for additional staff. However, the improving job market was offset by a second consecutive drop in monthly retail sales. Sales fell by 0.7% in January as German shoppers stayed at home, missing forecasts by 0.2%.
The Chinese Communist Party announced a proposal to repeal term limits for its president, setting the stage for current president Xi Jinping to rule beyond the end of his next term in 2023. Along with other constitutional revisions in the works, there is concern that China may transform from a one-party state to a one-man state, with the collection of policy changes now being referred to as ‘Xi Forever’.
Japan’s unemployment rate hit a 25-year low in January and the number of open jobs remained at a two-decade high, according to Japanese government data. The solid jobs market offers hope to policymakers that wages will rise, stoking long-overdue inflation. The seasonally adjusted unemployment rate fell to 2.4% in January, down ‑0.3% from December, according to Japan’s Internal Affairs ministry. Societe Generale’s chief economist Takuji Aida stated, “The jobless rate is likely to stabilize below 2.5% and underscore the view Japan is heading towards a sustained exit from deflation.” In a separate report, core consumer inflation in Tokyo—a proxy for national trends, accelerated 0.9% in February, suggesting that meaningful inflation is (finally) taking hold.
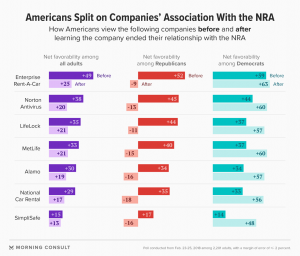
Finally: Following the tragic high school shooting in Parkland, Florida, some prominent companies have severed their relationships with the National Rifle Association (NRA). Many viewed these actions as attempts to curry favor with the press, Democrats and anti-NRA activists. By those measures, they were a success, as the actions drew praise from those segments of society. But how were they received by the country as a whole? It turns out, it’s a whole different picture. A Morning Consult survey of 2,201 U.S. adults conducted last week found an overall increase in negative views of companies that severed ties with the NRA. As expected, the reaction was split sharply down party lines with Republicans more likely to view distancing from the NRA as a bad decision, while Democrats viewed the move as a positive. The big difference is that Democrats view the move as just a modest positive whereas Republicans view it as a huge negative. Overall, the lesser increases in favorability among Democrats were dwarfed by the titanic decreases in favorability among Republicans. Taking the country as a whole showed an overall significant loss of favorability.
(sources: all index return data from Yahoo Finance; Reuters, Barron’s, Wall St Journal, Bloomberg.com, ft.com, guggenheimpartners.com, zerohedge.com, ritholtz.com, markit.com, financialpost.com, Eurostat, Statistics Canada, Yahoo! Finance, stocksandnews.com, marketwatch.com, wantchinatimes.com, BBC, 361capital.com, pensionpartners.com, cnbc.com, FactSet)
Indices mentioned are unmanaged and cannot be invested into directly. Past performance is no guarantee of future results. All Investing involves risk. Depending on the types of investments, there may be varying degrees of risk. Investors should be prepared to bear loss, including total loss of principal.