
Weekly Market Commentary
The very big picture:
In the “decades” timeframe, the current Secular Bull Market could turn out to be among the shorter Secular Bull markets on record. This is because of the long-term valuation of the market which, after only eight years, has reached the upper end of its normal range.
The long-term valuation of the market is commonly measured by the Cyclically Adjusted Price to Earnings ratio, or “CAPE”, which smooths out shorter-term earnings swings in order to get a longer-term assessment of market valuation. A CAPE level of 30 is considered to be the upper end of the normal range, and the level at which further PE-ratio expansion comes to a halt (meaning that increases in market prices only occur in a general response to earnings increases, instead of rising “just because”).
Of course, a “mania” could come along and drive prices higher – much higher, even – and for some years to come. Manias occur when valuation no longer seems to matter, and caution is thrown completely to the wind as buyers rush in to buy first and ask questions later. Two manias in the last century – the 1920’s “Roaring Twenties” and the 1990’s “Tech Bubble” – show that the sky is the limit when common sense is overcome by a blind desire to buy. But, of course, the piper must be paid and the following decade or two are spent in Secular Bear Markets, giving most or all of the mania gains back.

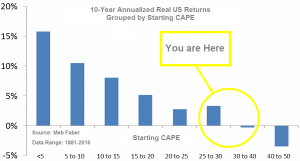
See Fig. 1 for the 100-year view of Secular Bulls and Bears. The CAPE is now at 31.74, up from the prior week’s 31.60, and still exceeds the level reached at the pre-crash high in October, 2007. This value is in the lower end of the “mania” range. Since 1881, the average annual return for all ten year periods that began with a CAPE around this level have been in the 0% – 3%/yr. range. (see Fig. 2).
In the big picture:
The “big picture” is the months-to-years timeframe – the timeframe in which Cyclical Bulls and Bears operate. The U.S. Bull-Bear Indicator (see Fig. 3) is in Cyclical Bull territory at 65.82, up slightly from the prior week’s 65.49.

In the intermediate and Shorter-term picture:
The Shorter-term (weeks to months) Indicator (see Fig. 4) turned positive on April 3rd. The indicator ended the week at 17, up from the prior week’s 9. Separately, the Intermediate-term Quarterly Trend Indicator – based on domestic and international stock trend status at the start of each quarter – was negative entering April, indicating poor prospects for equities in the second quarter of 2018.

Timeframe summary:
In the Secular (years to decades) timeframe (Figs. 1 & 2), the long-term valuation of the market is simply too high to sustain rip-roaring multi-year returns – but the market has entered the low end of the “mania” range, and all bets are off in a mania. The only thing certain in a mania is that it will end badly…someday. The Bull-Bear Indicator (months to years) is positive (Fig. 3), indicating a potential uptrend in the longer timeframe. In the intermediate timeframe, the Quarterly Trend Indicator (months to quarters) is negative for Q2, and the shorter (weeks to months) timeframe (Fig. 4) is positive. Therefore, with two indicators positive and one negative, the U.S. equity markets are rated as Neutral.
In the markets:
U.S. Markets: U.S. stocks rose for a second week as first-quarter earnings reporting season began in earnest. The week began with somewhat of a relief rally as investors appeared reassured that Russia did not respond to the U.S., France, and UK’s air strike on Syria. But the enthusiasm waned by the end of the week, and stocks gave back most of their gains. Nonetheless, the Dow Jones Industrial Average rose 102 points, or 0.4%, to close at 24,462. The technology-heavy NASDAQ Composite added 0.6% to close at 7,146. By market cap, smaller caps showed relative strength over large caps with the S&P 400 mid cap index and small cap Russell 2000 index both rising 0.9%, while the large cap S&P 500 index added 0.5%.
International Markets: Canada’s TSX added 1.4%, while the United Kingdom’s FTSE surged a fourth consecutive week by rising 1.4%. On Europe’s mainland, major markets were also green across the board. France’s CAC 40 rose 1.8%, Germany’s DAX added 0.8%, and Italy’s Milan FTSE vaulted 2.1%. Asian markets were mixed, with China’s Shanghai Composite ending down -2.8% while Japan’s Nikkei gained 1.8%. As grouped by Morgan Stanley Capital International, developed markets rose 0.4%, while emerging markets retreated -0.7%.
Commodities: Precious metals were mixed, with gold giving up some of the prior week’s gains while silver added to them. Gold ended the week down -0.7% closing at $1338.30 per ounce. In contrast, silver surged over 3%, ending the week at $17.16 per ounce. Oil followed last week’s strong gain with an additional 1.5% rise. West Texas Intermediate crude oil rose $1.01 to close at $68.40 per barrel. The industrial metal copper, used by some analysts as a barometer of global economic health due to its variety of uses, rose for a fourth consecutive week, up 2.1%.
U.S. Economic News: Claims for new unemployment benefits fell slightly to 232,000 last week, remaining near a 45-year low, according to the Labor Department. The reading reflects a booming jobs market where work is easy to find and companies are eager to find help. Initial jobless claims dipped 1,000 this week, slightly missing economists’ estimates for a 230,000 reading. The more stable monthly average of new claims rose by 1,250 to 231,250. The number of people applying for unemployment benefits is at levels not seen since the early 1970’s. Continuing claims, which counts the number of people already receiving benefits, fell by 15,000 to 1.86 million.
Confidence among the nation’s home builders retreated a fourth consecutive month after hitting its highest level since 1999 last December. The National Association of Home Builders (NAHB) reported its sentiment index ticked down one point to 69, missing estimates for a reading of 70. In the details, the gauge of current sales conditions was off by two points to 75, while the index of future sales expectations declined one point to 77. The index of buyer traffic remained unchanged at 51. While overall the reading is still strong, the fact that confidence is declining so steadily is notable. In late 2005, when the NAHB’s index started to fall, it was one of the signals that foreshadowed the coming housing bust.
Home builders broke more ground last month, and earlier estimates were revised up, as momentum in the housing market appears to have been better than originally reported. Housing starts ran at a seasonally-adjusted 1.32 million annual pace last month, up 2% from February and up 10.9% from the same time last year, the Commerce Department reported. The reading beat economists’ forecasts of a 1.255 million annual pace. Analysts were quick to point out that the Commerce Department’s reports are based on small samples and readings are often heavily revised. Permits, which are viewed as an indicator of future building activity, were also strong. Permits were up 2.5% from February’s reading and 7.5% higher than the same time last year.
The Commerce Department reported sales by U.S. retailers rose more than expected last month, its first gain in four months. Receipts advanced 0.6% in March, exceeding economists’ expectations of a 0.4% rise. Eight of thirteen major retail categories showed increases. Auto dealers posted their best month since last September, rising 2%. Internet retailers, pharmacies, and home furnishings stores were other big winners. Consumer optimism has held at relatively high levels thanks to factors including job-market strength, rising wages and lower taxes. Some analysts believe refunds from 2017 returns may have also given retail sales a boost in March.
Industrial production, which measures output at factories, mines and utilities, rose half a percent last month according to data from the Federal Reserve. While exceeding analysts’ estimates of a 0.3% gain, it was a sharp slowdown from the previous month’s advance. In the details of the report strong gains in mining and utilities were offset by a dramatic plunge in manufacturing. Mining output rose by 1% reflecting strong gains in oil and gas extraction, while utilities rose 3% prompted by an unusually cold March that extended the heating season. Manufacturing is believed to have been held down by concerns over escalating U.S.-China trade tensions and by supply bottle necks due to sanctions against other countries.
The New York Federal Reserve reported manufacturing activity in the New York-region gave up most of its gains from the previous month, falling almost 7 points to 15.8. In the details of the report, the new-orders index fell 7.8 points to 9, while the shipments index fell 9.5 points to 17.5. In employment, the readings were mixed. The number of employees gauge lost 3.4 points to 6, while the average workweek jumped 11 points to 16.9. Of concern, the 6-month outlook fell 26 points to 18.3, its lowest level in two years. T.J. Connelly, head of research at Contingent Macro Advisors noted, “The decline [in the six-month outlook] is coincident with concerns around trade wars and increased tariffs [and] should put us on high alert for further deterioration in business sentiment.”
In the city of Brotherly Love, the Philadelphia Federal Reserve’s Manufacturing Index added 0.9 point, rising to 23.2 for April. The increase, which was driven by a rise in input prices and prices received by manufacturers, exceeded economists’ forecasts of 20.1. Other categories that saw growth were the number of employees and average employee workweek. These readings support continued strength for employment in the manufacturing sector. Of concern for future growth, however, was weakness in both new orders and shipments. Another forward-looking index in the report, general business activity six months ahead, also reported weakness. Similar to the New York Fed’s report, the manufacturers in the Philadelphia region are also reporting concerns over trade tariffs announced by the Trump administration.
The Federal Reserve’s ‘Beige Book’, a summary and analysis of economic activity and conditions compiled from each of the district Federal Reserve banks, reported activity remained at a “modest to moderate pace” in March, despite widespread concerns about trade policy. In the labor market, the report stated wage pressures “did not escalate.” As has been the case for over a year now, labor markets continue to be tight, with continued reports of labor shortages for skilled workers. Nine of the twelve Fed regional banks expressed concerns about trade tariffs. Business owners were reported to be upset with the price rises for metals in the wake of the Trump administration’s decision to place penalties on steel and aluminum imports.
International Economic News: The Bank of Canada maintained its key interest rate at 1.25% this week, and said it was carefully assessing the timing of future rate hikes amid a backdrop of moderating growth. The central bank cited “softness” in the economy as the reason for holding rates steady. Still, bank governor Stephen Poloz said rates are still likely to rise over time to manage inflation. The bank said slower first-quarter growth of about 1.3% was largely a result of housing markets’ responses to stricter mortgage rules and sluggish exports. The bank had predicted the economy to expand by 2.5% in the first three months of the year. “Canada’s economic growth has moderated, and the economy is operating close to capacity,” the bank said in its latest monetary policy report, which was released alongside the rate announcement.
Mark Carney, governor of the Bank of England, unexpectedly dampened expectations for a rate hike next month stating policymakers will make their decision “conscious that there are other meetings” at which they could act this year. The remarks came as a surprise to investors who had considered an interest rate hike next month a sure thing. Mr. Carney also emphasized the impact of uncertainty surrounding the United Kingdom’s future trading relationship with the European Union, saying the uncertainty had “prevented what would otherwise have been a surge in investment in this economy.” The governor’s comments followed weaker-than-forecast inflation data, a drop in retail sales and mixed labor-market figures this week.
French Finance Minister Bruno LeMaire stated those rail workers’ rolling strikes, other social movements, and industrial actions in France are beginning to have a negative toll on economic growth in the country. In a radio interview, LeMaire said certain sectors, especially in the tourism and transportation industries, were already experiencing a negative impact from the strikes. France is facing a wave of strikes in several sectors, with state railway operator SNCF planning a total of 36 days of rolling strikes — which started on April 3 — over the next three months, to protest government reform plans. Students, trash collectors, electricity and energy sector staff, and employees of Air France are among those taking part in what has been called the biggest wave of industrial unrest since President Emmanuel Macron’s election last May.
In a poll published by the American Chamber of Commerce in Germany, more than half of U.S. companies doing business in the country want to hire extra employees and invest more. In addition, 82% of U.S. companies operating in Germany expect revenues to increase this year, despite a brewing trade conflict over the U.S. decision to impose tariffs on steel and aluminum imports. The AmCham Germany survey also found that 61% of U.S. companies with operations in Germany want to boost their activity there in the coming three to four years. Bernhard Mattes, President of AmCham Germany stated, “The results show that both Germany and the USA are still highly valued locations for investment despite the current political discord.”
In a disheartening development for citizens in the Eurozone’s third largest economy, Spaniards have now become wealthier than Italians. Spain’s per capita gross domestic product exceeded that of Italy last year, according to IMF data published this week that compares countries on a so-called “purchasing power parity” basis. The IMF also forecast that Spain would become 7% richer than Italy over the next five years. Analysts state Italy’s stagnant economy is both the cause and effect of increasingly bitter political divisions in the country where Italians are losing faith in the ability of their traditional parties to create jobs and restore growth.
China, with the world’s second largest economy, grew 6.8% in the first quarter of the year from the same period a year earlier. Fears of a trade war between the U.S. and China have risen sharply since the start of the year, but that doesn’t appear to have had much effect on economic activity in the nation, according to government data. However, that may be just the problem. The reading was exactly the same as the previous quarter. In fact, since 2015, China’s quarterly growth figures haven’t varied by more than 0.1% on a year-on-year basis. In contrast, in the U.S. swings of a full percentage point from quarter to quarter aren’t uncommon. Analysts note that the world has long suspected that China may be “adjusting” its numbers, which is why the investment community often relies on alternative measures, such as rail cargo volume, electricity use, and satellite imagery of factory sites. Andy Rothman, former U.S. diplomat in Beijing who is now an investment strategist at Matthews Asia says simply, “I suggest investors ignore China’s GDP growth rate.”
Japan is in the middle of its longest growth stretch in two decades, and while economists’ expect it to continue this year, next year (2019) is looking like the make-or-break year for the world’s third-largest economy. According to the International Monetary Fund, Japan’s growth will likely slow next year just as the government is set to raise sales taxes. That is also when the Bank of Japan has forecast that it will be reaching its inflation target, which means it may start winding down stimulus measures. The last time Japan’s sales tax was raised, it caused a recession and knocked 9 trillion yen ($86 billion) off of output. However, Prime Minister Shinzo Abe has already postponed the sales-tax increase twice before. The Fund’s forecast is based on the assumption that the Bank of Japan keeps interest rates close to zero through that period. If the BOJ does raise rates and start cutting stimulus as Governor Haruhiko Kuroda has suggested it might, that slowdown would likely come sooner, and be steeper.
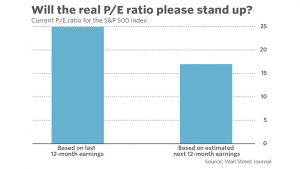
Finally: Is the U.S. stock market undervalued or overvalued based on its historical Price/Earnings (P/E) ratio? It turns out, the answer could be both! Market analyst Mark Hulbert wrote in a recent column for marketwatch.com that it all depends on how you calculate the measure. Some financial institutions calculate the current P/E ratio of the market based on its last 12-months of earnings (currently richly valued at 24.92), while others base it on the estimated next 12-month earnings (currently a much lower 16.98).
The dramatic difference between the two numbers leads to a world of confusion for individual and professional investors alike. Note that traditionally, the gold-standard for P/E calculations is using the prior 12-months of earnings. Therefore, the next time you hear an argument about whether the market is overvalued or undervalued on the basis of its P/E ratio, make sure that you make the proper distinction between the competing methods.
And, as Hulbert points out, be particularly wary of analysts who misleadingly mix the two by (typically) comparing the forward estimate with the backwards historical value. Hulbert says “Because analysts are almost always too optimistic, projected earnings will be markedly higher than trailing earnings. That in turn means that P/Es based on projected earnings will be significantly lower than P/Es based on trailing earnings. It’s an apples-to-oranges comparison.”
(sources: all index return data from Yahoo Finance; Reuters, Barron’s, Wall St Journal, Bloomberg.com, ft.com, guggenheimpartners.com, zerohedge.com, ritholtz.com, markit.com, financialpost.com, Eurostat, Statistics Canada, Yahoo! Finance, stocksandnews.com, marketwatch.com, wantchinatimes.com, BBC, 361capital.com, pensionpartners.com, cnbc.com, FactSet)
Indices mentioned are unmanaged and cannot be invested into directly. Past performance is no guarantee of future results. All Investing involves risk. Depending on the types of investments, there may be varying degrees of risk. Investors should be prepared to bear loss, including total loss of principal.