
4-16-18 Market Update
4-16-18 Market Update
The very big picture:
In the “decades” timeframe, the current Secular Bull Market could turn out to be among the shorter Secular Bull markets on record. This is because of the long-term valuation of the market which, after only eight years, has reached the upper end of its normal range.
The long-term valuation of the market is commonly measured by the Cyclically Adjusted Price to Earnings ratio, or “CAPE”, which smooths out shorter-term earnings swings in order to get a longer-term assessment of market valuation. A CAPE level of 30 is considered to be the upper end of the normal range, and the level at which further PE-ratio expansion comes to a halt (meaning that increases in market prices only occur in a general response to earnings increases, instead of rising “just because”).
Of course, a “mania” could come along and drive prices higher – much higher, even – and for some years to come. Manias occur when valuation no longer seems to matter, and caution is thrown completely to the wind as buyers rush in to buy first and ask questions later. Two manias in the last century – the 1920’s “Roaring Twenties” and the 1990’s “Tech Bubble” – show that the sky is the limit when common sense is overcome by a blind desire to buy. But, of course, the piper must be paid and the following decade or two are spent in Secular Bear Markets, giving most or all of the mania gains back.

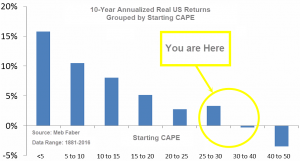
See Fig. 1 for the 100-year view of Secular Bulls and Bears. The CAPE is now at 31.60, up from the prior week’s 31.34, and still exceeds the level reached at the pre-crash high in October, 2007. This value is in the lower end of the “mania” range. Since 1881, the average annual return for all ten year periods that began with a CAPE around this level have been in the 0% – 3%/yr. range. (see Fig. 2).
In the big picture:
The “big picture” is the months-to-years timeframe – the timeframe in which Cyclical Bulls and Bears operate. The U.S. Bull-Bear Indicator (see Fig. 3) is in Cyclical Bull territory at 65.49, down slightly from the prior week’s 65.75.

In the intermediate and Shorter-term picture:
The Shorter-term (weeks to months) Indicator (see Fig. 4) turned positive on April 3rd. The indicator ended the week at 9, up from the prior week’s 7. Separately, the Intermediate-term Quarterly Trend Indicator – based on domestic and international stock trend status at the start of each quarter – was negative entering April, indicating poor prospects for equities in the second quarter of 2018.

Timeframe summary:
In the Secular (years to decades) timeframe (Figs. 1 & 2), the long-term valuation of the market is simply too high to sustain rip-roaring multi-year returns – but the market has entered the low end of the “mania” range, and all bets are off in a mania. The only thing certain in a mania is that it will end badly…someday. The Bull-Bear Indicator (months to years) is positive (Fig. 3), indicating a potential uptrend in the longer timeframe. In the intermediate timeframe, the Quarterly Trend Indicator (months to quarters) is negative for Q2, and the shorter (weeks to months) timeframe (Fig. 4) is positive. Therefore, with two indicators positive and one negative, the U.S. equity markets are rated as Neutral.
In the markets:
U.S. Markets: Stocks recorded solid gains and reversed the previous week’s losses, but volatility remained. Investors appeared to be more focused on the turbulent political theater going on in Washington rather than the first quarter’s upcoming corporate earnings reports. The Dow Jones Industrial Average added 427 points last week, closing at 24,360 – a gain of 1.8%. The technology-heavy NASDAQ Composite led all major U.S. indices by vaulting 2.8% to end the week at 7,106. By market cap, the large cap S&P 500 added 2.0%, while the mid cap S&P 400 and small cap Russell 2000 rose 1.6% and 2.4%, respectively.
International Markets: Almost all major international markets finished in the green. Canada’s TSX gained 0.4%, while the United Kingdom’s FTSE rose 1.1%. On Europe’s mainland, France’s CAC 40 added 1.1%, Germany’s DAX gained 1.6%, and Italy’s Milan FTSE rose 1.8%. In Asia, China’s Shanghai Composite finished the week up 0.9%, Japan’s Nikkei added 1.0%, and Hong Kong’s Hang Seng surged 3.2%. As grouped by Morgan Stanley Capital International, developed markets finished up 2.0%, while emerging markets added 1.0%.
Commodities: Precious metals added to their recent shine with Gold rising 0.9% or $11.80 to $1347.90 an ounce. Silver, which trades similarly to gold, added 1.8% and closed at $16.66 an ounce. The big commodity story was in energy, where a rally lifted crude oil to prices not seen since 2014. West Texas Intermediate crude oil surged 8.6% to $67.39 per barrel. Copper, viewed by some analysts as an indicator of global economic health due to its variety of industrial uses, rose a third straight week, up 0.4%.
U.S. Economic News: The Labor Department reported that the number of people applying for new unemployment benefits fell by 9,000 to 233,000 last week, remaining near a 45-year low. The less-volatile monthly average of new claims rose by 1,750 to 230,000. The number of claims retreated from the recent highs following the holiday-related boost at the end of March. Companies continue to report reluctance to letting employees go due to the shortage of skilled labor, and the unemployment rate remains near a 17-year low of 4.1%. Continuing claims, which counts the number of people already receiving benefits, increased by 53,000 to 1.87 million.
Prices at the wholesale level increased more than expected in the Labor Department’s latest reading, leading some analysts to speculate that inflation will be picking up this year. The Labor Department said its Producer Price Index (PPI) for final demand rose 0.3% last month, following a 0.2% increase in February. Economists had expected just a 0.1% increase. Services such as medical care, cable TV, and air travel all rose sharply last month, accounting for most of the increase in the PPI. Core PPI, which excludes food, energy, and trade services, rose 0.4% last month, its third consecutive gain. Over the past year, core PPI is up 2.9%, the biggest increase since August 2014.
Consumer prices posted their first drop in almost a year on (temporarily) lower energy prices. The Labor Department reported its Consumer Price Index (CPI) slipped 0.1% last month, its first drop since May of last year. Economists had forecast the CPI to remain unchanged. However, over the past 12 months through March the CPI increased 2.4% – its largest annual gain in a year. The so-called Core CPI, which excludes the volatile food and energy components, climbed 2.1%. Core CPI is now well above the 1.8% annual average increase over the past 10 years. The biggest contributors to the increase were healthcare costs and rising rents. Healthcare costs rose 0.4%, with prices for hospital care shooting up 0.6% and the cost of doctor visits rising 0.2%.
Sentiment among the nation’s small business owners drifted lower last month as concerns about the health of the economy outweighed the relief provided by lower taxes. The National Federation of Independent Businesses (NFIB) reported its small business confidence index fell 2.9 points to 104.7 last month. Despite the decline, the reading remains “among the highest in survey history”, according to the NFIB. Of note, the number of survey respondents that stated taxes were their number one business problem was the lowest since 1982. As has been the case for over a year now, owners continue to report having an increasingly difficult time filling jobs due to labor quality issues. In its release, the NFIB said “89% of those hiring or trying to hire report few or no qualified applicants for their open positions.”
Consumer sentiment slipped to a 3-month low as worries about how the Trump’s administration’s trade policies will impact the U.S. economy seemed to prompt a dip in consumer confidence this month. The University of Michigan reported its consumer-sentiment index was 97.8 this month, down from its 14-year high of 101.4 set in March. The reading missed economists’ expectations of a 100.0 reading. In a note to clients, JP Morgan Chase economist Daniel Silver wrote, “Some softening in sentiment is not too shocking given the weakening in equity markets over the past few months as well as what seems to be a string of negative headlines in the news.”
Minutes from the Federal Reserve’s meeting in March released this week revealed that “all” of the participants saw more interest-rate hikes as likely – no longer just “a majority”. The conversation centered on “how much” tightening would be needed rather than “whether” to hike at all. Several Fed officials thought the Fed might have to raise interest rates to a level that would act as a restraining factor for economic activity (some also argued that it might become necessary to signal this possibility in upcoming statements). The minutes showed the Fed is confident in its outlook that the economy would recover from its sluggish first quarter and that inflation would move up towards its 2% target.
International Economic News: The latest survey of business sentiment by the Bank of Canada revealed businesses are still upbeat despite worries about trade tensions and a slowing economy. The survey said “Business sentiment continues to be positive, supported by healthy sales prospects”, in its second quarterly business outlook of 2018. The survey’s main indicator, a composite of responses to inquiries regarding sales, hiring, and investment intentions, fell slightly from the previous survey in January, but remained at a high level. Analysts state the predominantly bullish report strengthens the case for another interest rate hike in the coming months. But most analysts are speculating that the central bank’s next move will be at the July meeting, rather than in April or May. The odds of a rate hike next week stand at 21.5% but rise to 72.3% for July, according to Bloomberg’s interest-rate probability tracker.
The United Kingdom’s economy has had a difficult start to the year, according to one of Britain’s leading think-tanks the National Institute for Economic and Social Research (NIESR). The NSIESR said growth is expected to have fallen by half in the opening months of the year, from 0.4% at the end of last year to 0.2% in the first quarter. Analysts note that at least some if not all of the weakness can be attributed to the brutal winter storm that hit the UK, dubbed the “beast from the east” in the media. In the details of the report, manufacturing output was flat in January and retreated slightly in February. Construction remained firmly in recession and export volumes were rising but less quickly than imports.
French President Emmanuel Macron said France must face up to new economic challenges and that strikes and protests will not prevent him from implementing economic changes in the country. The statements came hours ahead of a new round of train worker strikes. Train workers, hospital staff, students, retirees, lawyers, and magistrates have been challenging his economic vision which includes dismantling many of France’s generous labor rights. Macron said public anger “doesn’t stop” him and vowed to continue with the train reforms meant to open up France’s national SNCF railway to competition. In what some portray as a fight for the identity of France, Macron wants to reduce the role of the state and inject vitality in the economy by trimming guarantees for workers and increasing competition among companies, among other things. His critics say he is favoring the rich and eroding workers’ hard-won labor rights with moves that risk increasing wealth disparity in a country whose national motto includes the word “equality.”
Germany’s Economy Ministry stated the nation’s economic upswing is expected to lose some steam due to the “insecurity caused by the latent trade conflicts.” In its report, the ministry stated Germany’s economic upswing “softened a little” at the start of the year as industrial turnover slipped slightly and business executives scaled back their lofty expectations. Without giving a forecast for the first quarter, the ministry said Germany’s economy continues to follow a “solid” growth path. The latest soft patch “does not signal an end to the upswing,” the ministry said, but cautioned that the current trade disputes are clouding the outlook.
China’s President Xi Jinping gave a speech to business leaders attending “The Boao Forum”, often referred to as “Asia’s Davos”, in which he vowed to slash auto tariffs and improve intellectual property protections in possible concessions aimed at defusing a looming trade war with the United States. He promised progress in areas that are U.S. priorities, including opening China’s banking industry and boosting imports. However, despite the soothing words, analysts are adamant that China remains a closed economy. A February IMF study on measures of trade and investment openness found China was not only more closed than the average developed economy, but also more closed than the average emerging market economy. In its latest reading, China’s trade surplus with the United States surged nearly 20% in the first quarter, with some analysts speculating exporters were rushing to get shipments out ahead of threatened tariffs.
A Reuters poll of economists showed that Japan’s longest run of economic growth since the 1980s was expected to stall in the first quarter, but to regain momentum over the course of the year. The economy was seen growing at an annualized rate of 0.5% in the first quarter as consumer spending and factory output weakened, the poll of economists taken this week found. That’s down from 1.6% annualized growth in the fourth quarter. Yoshiki Shinke, chief economist at Dai-ichi Life Research Institute stated, “Consumer spending and industrial production likely weakened during the period due to such factors as the cold weather and higher vegetable prices. But the trend of moderate economic recovery has not changed as the overseas economy is solid.” The economists predicted that the economy will expand 1.3% over the fiscal year that started in April, down from the expected 1.8% for the fiscal year just ended in March.
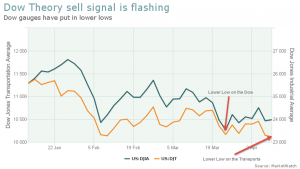
Finally: A “Dow Theory” sell signal has been triggered after the Dow Jones Transportation Average closed below its February lows, following the Dow Jones Industrial Average in doing so.
In short, the theory states that poor performance from both the industrials and the transports at the same time bodes poorly for the broader market. The theory is a market timing tool that has stood the test of time for over 100 years. Spitting in the eye of the signal, the Dow rallied over 400 points the next day!
One well-known market analyst says “fuggedaboudit”. James Saut, Chief Investment Strategist at Raymond James, released a note to clients stating that many non-market related factors were at play such as the FBI raid of President Donald Trump’s lawyer’s offices sparking a sell-off, and that “we are going to ignore this sell signal” given that the earnings outlook is so strong. Similarly, Frank Cappelleri, Chief Market Technician at Instinet LLC, also downplayed any significance by saying that market timing tools like Dow Theory are “interesting signs and potential signals to point out, but sometimes they play out and sometimes they don’t.”
(sources: all index return data from Yahoo Finance; Reuters, Barron’s, Wall St Journal, Bloomberg.com, ft.com, guggenheimpartners.com, zerohedge.com, ritholtz.com, markit.com, financialpost.com, Eurostat, Statistics Canada, Yahoo! Finance, stocksandnews.com, marketwatch.com, wantchinatimes.com, BBC, 361capital.com, pensionpartners.com, cnbc.com, FactSet)
Indices mentioned are unmanaged and cannot be invested into directly. Past performance is no guarantee of future results. All Investing involves risk. Depending on the types of investments, there may be varying degrees of risk. Investors should be prepared to bear loss, including total loss of principal.