
9-9-19 Weekly Market Update
The very Big Picture:
The long-term valuation of the market is commonly measured by the Cyclically Adjusted Price to Earnings ratio, or “CAPE”, which smooths out shorter-term earnings swings in order to get a longer-term assessment of market valuation. A CAPE level of 30 is considered to be the upper end of the normal range, and the level at which further PE-ratio expansion comes to a halt (meaning that increases in market prices only occur in a general response to earnings increases, instead of rising “just because”). The market is currently at that level.
Of course, a “mania” could come along and drive prices higher – much higher, even – and for some years to come. Manias occur when valuation no longer seems to matter, and caution is thrown completely to the wind as buyers rush in to buy first and ask questions later. Two manias in the last century – the 1920’s “Roaring Twenties” and the 1990’s “Tech Bubble” – show that the sky is the limit when common sense is overcome by a blind desire to buy. But, of course, the piper must be paid and the following decade or two are spent in Secular Bear Markets, giving most or all of the mania gains back.
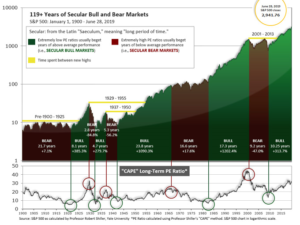
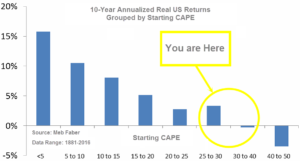
See Fig. 1 for the 100-year view of Secular Bulls and Bears. The CAPE is now at 29.86, up from the prior week’s 29.32, above the level reached at the pre-crash high in October, 2007. Since 1881, the average annual return for all ten year periods that began with a CAPE around this level have been in the 0% – 3%/yr. range. (see Fig. 2).
In the Big Picture:
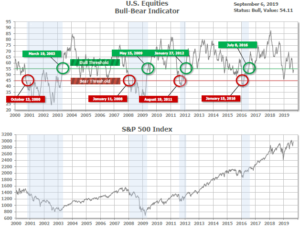
The “big picture” is the months-to-years timeframe – the timeframe in which Cyclical Bulls and Bears operate. The U.S. Bull-Bear Indicator (see Fig. 3) is in Cyclical Bull territory at 54.11, up from the prior week’s 52.42.
In the intermediate and Shorter-term picture:
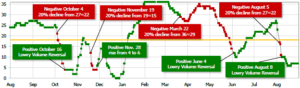
The Shorter-term (weeks to months) Indicator (see Fig. 4) is positive. The indicator ended the week at 10, up from the prior week’s 7. Separately, the Intermediate-term Quarterly Trend Indicator – based on domestic and international stock trend status at the start of each quarter – was positive entering July, indicating positive prospects for equities in the third quarter of 2019.
Timeframe Summary:
In the Secular (years to decades) timeframe (Figs. 1 & 2), the long-term valuation of the market is historically too high to sustain rip-roaring multi-year returns. The Bull-Bear Indicator (months to years) remains positive (Fig. 3), indicating a potential uptrend in the longer timeframe. In the intermediate timeframe, the Quarterly Trend Indicator (months to quarters) is positive for Q3, and the shorter (weeks to months) timeframe (Fig. 4) is positive. Therefore, with three indicators positive and none negative, the U.S. equity markets are rated as Positive.
In the Markets:
U.S. Markets: Domestic markets recorded a second week of gains as optimism grew that progress would be made in the U.S.-China trade dispute. The Dow Jones Industrial Average gained 394 points last week and closed at 26,798, a gain of 1.5%. The technology-heavy NASDAQ Composite added 1.8% and regained the 8000-level finishing the week at 8,103. By market cap, the large-cap S&P 500 returned to within 2% of its recent highs adding 1.8%. The S&P 400 Mid Cap index and small cap Russell 2000 index rose 1.6% and 0.7%, respectively.
International Markets: Canada’s TSX gained 0.6% while the United Kingdom’s FTSE added 1.0%. On Europe’s mainland France and Germany each rose for a third consecutive week. France’s CAC 40 tacked on an additional 2.3% while Germany’s DAX gained 2.1%. In Asia, China’s Shanghai Composite surged 3.9% and Japan’s Nikkei rallied 2.4%. As grouped by Morgan Stanley Capital International, developed markets rose 2.1%, while emerging markets added 2.6%.
Commodities: Precious metals reined in some of their recent gains, restrained by the strength in the equities markets. Gold retreated -$13.90 to $1515.50 an ounce, a decline of -0.9%. Silver spiked to over $19.50 an ounce before closing down -1.2% to $18.12 an ounce. Oil managed a second week of gains, West Texas Intermediate crude oil rose 2.6% to $56.52 per barrel. The industrial metal copper, sometimes referred to as “Dr. Copper” for its ability to forecast global economic growth, rallied 3.2%.
U.S. Economic News: The number of Americans seeking first-time unemployment benefits ticked up last week, but remained near their lowest levels in almost half a century. The Labor Department reported initial jobless claims edged up by 1,000 to 217,000 last week, exceeding the consensus forecast of 213,000. The less-volatile monthly average of new claims rose by 1,500 to 216,250. Thomas Simons, senior money market economist at Jefferies LLC wrote in a note to clients, “The labor market remains tight and solid, layoff activity is light and there is no evidence in the economic data that suggests that these conditions will change any time soon.” Continuing claims, which counts the number of people already receiving benefits, fell by 39,000 to 1.66 million.
Payrolls processor ADP reported 195,000 private-sector jobs were added last month. Economists had only expected 150,000. By size, small businesses added 66,000 jobs, medium-sized 77,000, and large companies added 52,000. By occupation the strength was concentrated in education and the healthcare sectors. Paul Ashworth, chief U.S. economist at Capital Economics, stated “The U.S. economy is hanging in there, even though the manufacturing sector specifically is in recession.”
Contrary to the cheery ADP number reported above, the Bureau of Labor Statistics’ monthly Non-Farm Payrolls (NFP) said the economy added just 130,000 new jobs in August. The reading was the smallest increase in three months, giving further evidence to analysts that hiring is slowing amid global growing trade tensions. Economists had forecast that 170,000 new jobs would be added. Analysts note the soft employment figures mean the Federal Reserve is still on track to cut interest rates at its meeting later this month. The gain was even weaker if hiring tied to the upcoming U.S. census is stripped out. The government reported the private sector added less than 100,000 new jobs last month, just a little more than half the number reported by ADP above. Chief U.S. economist Steven Blitz of TS Lombard stated, “When the numbers soften like this, the economy is slowing.” The unemployment rate remained unchanged at 3.7%.
A pair of surveys of the manufacturing sector revealed that the manufacturing sector remains under pressure as U.S.-China trade tensions persist. The Institute for Supply Management (ISM) acknowledged a “notable decrease” in business confidence in its latest manufacturing survey. ISM’s manufacturing index for August fell to 49.1 from 51.2 in July. Readings below 50 indicate a contraction in activity. The latest reading is the lowest since January of 2016. Economists had expected the index to slip to just 51.0. In the details of the report, the new orders index sank 3.6 points to 47.2, while the production index fell 1.3 points to 49.5. Of the eighteen manufacturing industries surveyed, only nine reported growth and only three reported gains in new orders. Separately, IHS Markit reported that its manufacturing Purchasing Managers Index (PMI) improved moderately in the final reading in August. The index rose to 50.3 in August from the 49.9 flash reading. It was still below July’s 50.4 and is the lowest reading since September 2009. Richard Moody, chief economist at Regions Financial Corp., stated that inventory overhang, slowing vehicle sales, and Boeing’s trouble with its 737 MAX have all contributed to the sector’s weakness.
The U.S. trade deficit declined 2.7% in July, but the overall trade gap is still huge and growing, analysts say. Higher exports of drugs, oil, and vehicles lowered the trade deficit by 3% in July, but the nation’s trade gap is still greater now than at the same time last year. The deficit now stands at $54 billion, down $1.5 billion from June, the government said. Economists had forecast a deficit of $53.4 billion. Although the deficit with China has fallen after the imposition of U.S. tariffs, the gap has increased with Mexico, the European Union and South Korea. The U.S. trade gap through the first seven months of 2019 totaled $374 billion vs. $346 billion in the same span in 2018.
The Federal Reserve’s “Beige Book”, a collection of anecdotal information on current economic conditions from each of its twelve districts, found economic activity was holding steady or improving in most sectors except manufacturing and farming. The overall economy expanded at the same “modest pace” seen in earlier reports this year, the survey said. While there was continued uncertainty over U.S. trade policy with China, a majority of business owners “remain optimistic about the near-term outlook,” the Fed found. Manufacturing and agriculture were the two weak spots in the late summer. Many economists think that weak manufacturing and agriculture will not be enough to push the economy into a recession. This edition of the Beige Book report seems to fit with the same 2% growth rate seen in the first half of the year.
Federal Reserve Chairman Jerome Powell stated Friday that the most recent monthly gauge of the U.S. labor market fit into an overall picture of a robust jobs market and economy. In a question-and-answer session Powell said the outlook for the economy remains favorable and the future is likely to be one of moderate economic expansion. Powell said the central bank is “not forecasting or expecting, a recession.” “Incoming data for the U.S. suggests that the most likely outlook for the U.S. is still moderate growth, a strong labor market, and inflation continuing to move back up,” he said. Repeating his message from Jackson Hole, Wyo., Powell said there are “significant” downside risks facing the economy and said the Fed is going to monitor all these factors.
International Economic News: Canada’s economy gained a much larger than expected 81,100 new jobs in August, reported Statistics Canada. Analysts had forecast a gain of just 15,000 jobs. The national unemployment rate held steady, as expected, at 5.7%. Wages for permanent employees increased by 3.8% from the same time last year. In the details of the report, Statistics Canada said 20,500 more people were working in educational services in August. Finance, insurance, real estate, rental and leasing were also up, rising by 22,400 in August, while the professional, scientific and technical services sector saw an increase of 16,800 jobs.
A Nobel prize-winning economist says that Britain’s deepening Brexit crisis is an economic ‘disaster’. Christopher Pissarides, a professor of economics at the London School of Economics stated this week, “What is happening is a disaster for the economy, looking at it from a purely economic point of view.” British Prime Minister Boris Johnson is currently under immense pressure to deliver Brexit, with just 55 days left to go before the world’s fifth-largest economy is scheduled to leave the European Union. It remains a deeply divisive issue in the U.K., more than three years after a small majority voted to leave the bloc.
On Europe’s mainland, ministers from Germany and France outlined plans to protect its steel industries by proposing a reduction in tariff-free imports from outside of the bloc. German Minister of Economics Peter Altmaier and his French counterpart Bruno Le Maire penned a joint letter to the EU Trade Commissioner calling for a 2% reduction in imports. Economists state the leading nations in the Eurozone fear the steel markets could become “flooded” with cheap imports as Berlin scale backs its production. The leading German trade association Stahl had warned in June an increase in the volume of duty-free steel imports would be “directly at the expense of domestic industry”.
China’s central bank, the Peoples Bank of China (PBOC), stepped in to support its economy by injecting $126 billion into its financial system as the trade war between the United States and China drags on. In addition, the PBOC said it would slash the reserve requirement ratio for most of its financial institutions by 50 basis points, allowing greater lending. The moves signaled China’s willingness to take action to boost its economy. China’s economic growth slumped to its lowest level in nearly three decades in the second quarter. Industrial production, an important indicator for the country’s economy, also posted its worst growth in 17 years.
A key index reflecting the current state of the Japanese economy ticked up in July, helped by positive industrial production, Japan’s government said. Japan’s Cabinet Office reported its coincident index of business conditions for July increased 0.3 point from the previous month to 99.8 against the 2015 base of 100. The office maintained its assessment for the third straight month, stating that the downward trend in the Japanese economy is coming to a halt. The data appears to support the government’s official view that Japan’s economy is recovering at a moderate pace. The leading index of business conditions, which predicts the trend in the coming months, was unchanged from the previous month at 93.6.
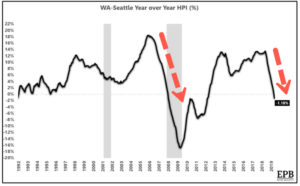
Finally: Nobel laureate economist Robert Shiller stated in an interview on Bloomberg this week that he “wouldn’t be at all surprised” if U.S. home prices started to fall. Shiller warned that fears of a recession driven by economic narratives such as the trade war and inverted yield curves could be just enough negativity to weigh on consumers’ desire to purchase a home. Last week, home sales, mortgage applications, housing starts, and permits all missed expectations. Shiller’s own gauge of the housing market, the S&P CoreLogic Case-Shiller home price index rose just 0.11% month-over-month (half the expected rise) and slowed to just a 6.3% year-over-year gain—its weakest reading since December of 2017. The “canary in the coal mine” moment for housing prices will come when some of the hottest markets begin to roll over. But wait – one already has: Seattle, the home of Amazon, Microsoft, Starbucks and many other hot, growing companies. Seattle’s Home Price Index (HPI) went negative year-over-year in May, as shown in the chart below from EPB Macro Research. Should another hot market do the same, showing that Seattle is not an anomaly, we’ll have a trend – and not a good one.
(Sources: all index return data from Yahoo Finance; Reuters, Barron’s, Wall St Journal, Bloomberg.com, ft.com, guggenheimpartners.com, zerohedge.com, ritholtz.com, markit.com, financialpost.com, Eurostat, Statistics Canada, Yahoo! Finance, stocksandnews.com, marketwatch.com, wantchinatimes.com, BBC, 361capital.com, pensionpartners.com, cnbc.com, FactSet) Securities offered through Registered Representatives of Cambridge Investment Research Inc., a broker-dealer, member FINRA/SIPC. Advisory Services offered through Cambridge Investment Research Advisors, a Registered Investment Adviser. Strategic Investment Partners and Cambridge are not affiliated.
Indices mentioned are unmanaged and cannot be invested into directly. Past performance is no guarantee of future results. All Investing involves risk. Depending on the types of investments, there may be varying degrees of risk. Investors should be prepared to bear loss, including total loss of principal.