
9-2-19 Weekly Market Update
The Very Big Picture:
The long-term valuation of the market is commonly measured by the Cyclically Adjusted Price to Earnings ratio, or “CAPE”, which smooths out shorter-term earnings swings in order to get a longer-term assessment of market valuation. A CAPE level of 30 is considered to be the upper end of the normal range, and the level at which further PE-ratio expansion comes to a halt (meaning that increases in market prices only occur in a general response to earnings increases, instead of rising “just because”). The market is currently at that level.
Of course, a “mania” could come along and drive prices higher – much higher, even – and for some years to come. Manias occur when valuation no longer seems to matter, and caution is thrown completely to the wind as buyers rush in to buy first and ask questions later. Two manias in the last century – the 1920’s “Roaring Twenties” and the 1990’s “Tech Bubble” – show that the sky is the limit when common sense is overcome by a blind desire to buy. But, of course, the piper must be paid and the following decade or two are spent in Secular Bear Markets, giving most or all of the mania gains back.
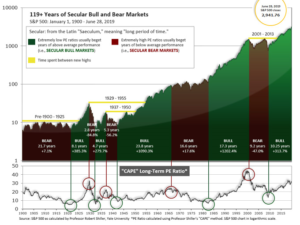
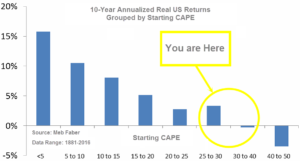
See Fig. 1 for the 100-year view of Secular Bulls and Bears. The CAPE is now at 29.32, up from the prior week’s 28.55, above the level reached at the pre-crash high in October, 2007. Since 1881, the average annual return for all ten year periods that began with a CAPE around this level have been in the 0% – 3%/yr. range. (see Fig. 2).
In the Big Picture:
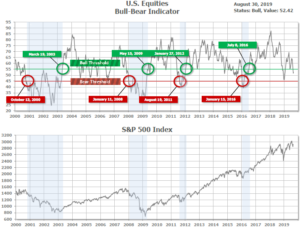
The “big picture” is the months-to-years timeframe – the timeframe in which Cyclical Bulls and Bears operate. The U.S. Bull-Bear Indicator (see Fig. 3) is in Cyclical Bull territory at 52.42, up from the prior week’s 51.67.
In the Intermediate and Shorter-term Picture:
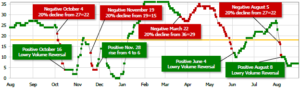
The Shorter-term (weeks to months) Indicator (see Fig. 4) is positive. The indicator ended the week at 7, unchanged from the prior week. Separately, the Intermediate-term Quarterly Trend Indicator – based on domestic and international stock trend status at the start of each quarter – was positive entering July, indicating positive prospects for equities in the third quarter of 2019.
Timeframe Summary:
In the Secular (years to decades) timeframe (Figs. 1 & 2), the long-term valuation of the market is historically too high to sustain rip-roaring multi-year returns. The Bull-Bear Indicator (months to years) remains positive (Fig. 3), indicating a potential uptrend in the longer timeframe. In the intermediate timeframe, the Quarterly Trend Indicator (months to quarters) is positive for Q3, and the shorter (weeks to months) timeframe (Fig. 4) is positive. Therefore, with three indicators positive and none negative, the U.S. equity markets are rated as Positive.
In the Markets:
U.S. Markets: U.S. stocks had their best week in nearly three months as investors appeared more confident that a trade deal would be reached between the U.S. and China. After four consecutive weeks of selling the Dow Jones Industrial Average rebounded 30% and closed at 26,403. The technology-heavy NASDAQ Composite added 2.7% finishing at 7,962. By market cap, the large cap S&P 500 added 2.8%, while the mid cap S&P 400 and small cap Russell 2000 each rose 2.4%.
International Markets: Most international markets also rebounded a bit from recent weeks of selling. Canada’s TSX rose 2.5% and the United Kingdom’s FTSE gained 1.6%. On Europe’s mainland, France’s CAC 40 added 2.9%, Germany’s DAX rose 2.8%, and Italy’s Milan FTSE surged 4.2% for the week. In Asia, China’s Shanghai Composite finished down -0.4%, while Japan’s Nikkei ended essentially flat down just -0.03%. As grouped by Morgan Stanley Capital International, emerging markets gained 2.9% while developed markets rose 2.0%.
Commodities: Gold had its first down week in five as the equities markets recovered. The precious metal gave up half a percent, closing at $1529.40 an ounce. Silver surged last week, climbing 5.3% and closing at $18.34 an ounce. Energy retraced some of last week’s loss by adding 1.7% and closing at $55.10 per barrel. The industrial metal copper, viewed by analysts as a barometer of global economic health due to its wide variety of industrial uses, rebounded 0.9%.
August Summary: For the month of August, the Dow fell -1.7%, the NASDAQ -2.6%, and the S&P 500 ‑1.8%. The smaller cap S&P 400 and Russell 2000 indexes retreated a much deeper -4.4% and -5.1%, respectively. Canada’s TSX managed a slight gain of 0.2%, but all other major international indexes finished the month down. The UK’s FTSE retreated -5%, while France’s CAC 40 and Germany’s DAX gave up -0.7% and -2.1%, respectively. China’s Shanghai Composite fell -1.6% and Japan’s Nikkei finished down -3.8%. Emerging markets retreated -3.8% and developed markets lost -1.9%. Gold and silver were the big winners in August, rising 6.4% and 11.8% in August, respectively, while oil and copper ended the month down -5.9% and -4.4%.
U.S. Economic News: The number of Americans seeking first-time unemployment benefits rose slightly last week but remained near multi-decade lows. The Labor Department reported jobless claims rose by 4,000 to 215,000, nearly matching economists’ estimates of 214,000. The less-volatile monthly average of new claims ticked down by 500 to 214,500. Both readings remain near 50-year lows. Continuing claims, which counts the number of people already receiving benefits, climbed by 22,000 to 1.7 million. These claims are also near a more than 40-year low. Thomas Simons, senior money market economist at Jefferies LLC stated in a note to clients, “The labor market remains tight and solid, layoff activity is light and there is no evidence in the economic data that suggests that these conditions will change any time soon.”
Home prices are rising at their slowest pace in almost seven years, according to the latest S&P CoreLogic Case-Shiller 20-city home price index. The index fell from an annual rate of growth of 2.4% to 2.1%. That’s down from an annual rate of 6.3% just one year ago. Of the 20 cities surveyed, 17 still posted increases but most were quite small. Over the past year, prices have risen the fastest in Phoenix and Las Vegas, up 5.8% and 5.5%, respectively. Seattle was the only city to have prices actually decline, down -1.3%. More broadly, the Case-Shiller nationwide home index showed prices were up 3.1% in June from the same time last year, down 0.2% from the previous month.
The number of homes in which a contract has been signed but not yet closed fell in July, following two months of gains. The National Association of Realtors (NAR) reported its index of pending home sales plunged ‑2.5% last month, far exceeding economists’ expectations of just a -0.3% decline. All four regions of the country saw a decline in contract signings, with the West experiencing the largest declines. In the Northeast sales fell -1.6%, while in the South sales were down -2.4%. In the Midwest sales declined -2.5% and in the West sales were off ‑3.4%. Compared to the same time last year, contract signings were down ‑0.3%. Lawrence Yun, the NAR’s chief economist wrote, “Economic uncertainty is no doubt holding back some potential demand, but what is desperately needed is more supply of moderately priced homes.”
The Commerce Department reported that orders for manufactured goods expected to last at least three years, so-called “durable goods”, jumped last month, led by airplane manufacturers. Orders for commercial aircraft surged 47.8%, predominantly due to Boeing. Overall, orders for durable goods rose 2.1% in July, exceeding the consensus forecast of a 0.9% increase. Excluding the transportation sector, however, “core” orders were actually down ‑0.4%, their biggest drop since March. Ian Shepherdson, chief economist at Pantheon Macroeconomics stated after the release, “No bottom yet for core orders.”
American consumers remain very confident in the U.S. economy despite the lingering trade dispute with China. The Conference Board reported its closely followed survey of consumer confidence fell -0.7 point to 135.1 in August. Economists had predicted the index would plunge to 127.8 as the trade dispute between the U.S. and China hit financial markets earlier this month and sent interest rates plunging. The index remained near its post 2008 recession peak of 137.9 set last October. The present situation index component, which measures how consumers feel about the economy “right now”, rose to 177.2 from 170.9. However the index which looks out over the next six months – the expectations index – appeared to reflect more worry as it slipped 5.4 points to 107. Lynn Franco, senior director of economic indicators at the board stated, “While other parts of the economy may show some weakening, consumers have remained confident and willing to spend.”
Americans increased their spending in July as households purchased a broad range of goods and services. The Commerce Department reported that consumer spending, which accounts for more than two-thirds of U.S. economic activity, rose 0.6% last month following a 0.3% gain in June. Economists had expected a gain of 0.5%. In the details, spending on goods surged 0.9% as Americans spent more in July on new cars and trucks, especially recreational vehicles. Spending on services increased 0.5%. The increase in consumer spending in July was largely sourced from savings as personal income edged up just 0.1%, the smallest rise since last September.
The U.S. economy grew a bit slower in the spring than originally reported due to slowing exports and weaker corporate investment. The Commerce Department reported gross domestic product (GDP), the official scorecard for the economy, expanded at a 2% annual pace from April to June. The government had initially estimated the U.S. had expanded at a 2.1% rate. GDP had slowed from a 3.1% gain in the first three months of the year. In the details, while consumer spending was stronger than originally reported (upped from 4.4% to 4.7%), the level of inventories declined and exports fell even more sharply, down -5.8%. Most other figures in the report were little changed. The government revises GDP twice after the original release to incorporate the latest data.
International Economic News: Canada’s economy expanded more strongly than expected in the second quarter as shipments by Canadian exporters rose 13%. Statistics Canada reported Canada’s economy grew at an annualized pace of 3.7% in the three months through June. The increase followed just a 0.5% gain in the first quarter. Analysts note, however, that the underlying details were less impressive than the headline. While growth was strong in exports, growth in household consumption came to a near halt and business investment shrank by the most in more than two years. In effect, domestic demand was in contraction in the second quarter. Brian DePratto, senior economist at Toronto-Dominion Bank wrote in a note to investors, “This was a ‘less than meets the eye’ report. Not only were today’s details weak, but since the second quarter ended we’ve seen yet another escalation in the trade wars and associated uncertainty.”
Across the Atlantic, the Britain’s Prime Minister Boris Johnson moved to suspend the Parliament shortly after lawmakers return from their summer recess in early September. Johnson aims to stop his political opponents from forcing him to request another Brexit extension to avoid a “no deal” exit from the European Union on October 31. Johnson has been trying to convince EU leaders that he is serious about a no deal Brexit in the hopes that they would be willing to renegotiate the Theresa May deal and secure better terms for the U.K. Thus far, EU leaders have rebuffed those efforts with analysts saying they’ve been emboldened by British Members of Parliament who have been trying to block the no deal effort.
On Europe’s mainland, economists noted the French are finally doing something better than the Germans. After a very tough 2018 for French President Emmanuel Macron, the second-largest economy in the monetary union is faring better than most experts would have assumed. France’s economic model is much less reliant on exports than Germany, and therefore its economy is proving to be more resilient in the face of rising global trade tensions. In addition, the French government’s decision to implement fiscal stimulus last year in the wake of “yellow vest” protests has provided support to the country just as the European economy slowed. French gross domestic product expanded by 0.2% in the second quarter. While that was slightly less than expected, it was in line with the euro zone as a whole and was better than Italy and Germany.
Bad news became worse for Germany where retail sales dropped even more than expected. German statistics agency Destatis reported that retail sales fell a seasonally-adjusted 2.2% last month, its biggest decline since last December. With the exception of June, monthly retail sales figures have either declined or been flat for the last five months. The data came days after a survey revealed that employers are posting fewer jobs, intensifying fears that the downturn in the country’s manufacturing industry has spread into the wider economy. The export-dependent economy shrank 0.1% in the second quarter, triggering a warning from Germany’s Bundesbank that a recession is likely.
Factory activity in China declined in August for the fourth month in a row. China’s National Bureau of Statistics reported its Purchasing Managers’ Index (PMI) fell into further into contraction to 49.5 in August, down from 49.7 last month (values below 50 indicate contraction, 50 and above indicate expansion). A Reuters poll showed analysts expected the PMI to remain unchanged. The official factory gauge showed growing trade frictions with the United States and cooling global demand continued to weigh on China’s exporters. Total new orders – from home and abroad – also continued to fall, indicating domestic demand remains soft, despite a flurry of growth-boosting measures over the past year. “Frontloading of exports to the U.S. ahead of higher tariffs supported trade and overall activity growth, but this effect will likely fade in the next few months,” said analysts at Goldman Sachs.
Japan’s government left its assessment that the economy is recovering at a moderate pace unchanged in August, with weakness continuing to center on exports, according to a monthly economic report released by its Cabinet Office this week. In the short term, the report warned that “attention should be given to the effects of the intensified tension over trade issues on the world economy.” The Cabinet Office also left its assessment on exports unchanged in the latest report, saying they are “in a weak tone.” The report upgraded its evaluation on public investment for the first time in three months, however, citing public works projects, including those for disaster recovery.
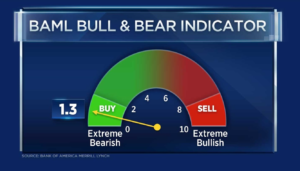
Finally: Investment “contrarians” are those who look for extremes in sentiment as signals that it is time to “go the other way”. Analysts at Bank of America Merrill Lynch (BAML) said in a research note that a contrarian “buy signal” had been triggered following the market sell-off in the month of August. In its note, BAML said its “Bull & Bear” sentiment indicator had tumbled from 2.4 to 1.3, triggering the signal – the first one since January of this year. A reading below 2 on its “Bull & Bear” sentiment indicator is classed as extremely bearish and causes a buy signal to flash. The bank said this week’s drop into buy territory had been due to outflows in emerging market debt and equities, as well as a rapid rally in Treasury markets. (Chart from CNBC, using data from BAML)
(Sources: all index return data from Yahoo Finance; Reuters, Barron’s, Wall St Journal, Bloomberg.com, ft.com, guggenheimpartners.com, zerohedge.com, ritholtz.com, markit.com, financialpost.com, Eurostat, Statistics Canada, Yahoo! Finance, stocksandnews.com, marketwatch.com, wantchinatimes.com, BBC, 361capital.com, pensionpartners.com, cnbc.com, FactSet) Securities offered through Registered Representatives of Cambridge Investment Research Inc., a broker-dealer, member FINRA/SIPC. Advisory Services offered through Cambridge Investment Research Advisors, a Registered Investment Adviser. Strategic Investment Partners and Cambridge are not affiliated.
Indices mentioned are unmanaged and cannot be invested into directly. Past performance is no guarantee of future results. All Investing involves risk. Depending on the types of investments, there may be varying degrees of risk. Investors should be prepared to bear loss, including total loss of principal.