
9-16-19 Weekly Market Update
The Very Big Picture:
The long-term valuation of the market is commonly measured by the Cyclically Adjusted Price to Earnings ratio, or “CAPE”, which smooths out shorter-term earnings swings in order to get a longer-term assessment of market valuation. A CAPE level of 30 is considered to be the upper end of the normal range, and the level at which further PE-ratio expansion comes to a halt (meaning that increases in market prices only occur in a general response to earnings increases, instead of rising “just because”). The market is currently at that level.
Of course, a “mania” could come along and drive prices higher – much higher, even – and for some years to come. Manias occur when valuation no longer seems to matter, and caution is thrown completely to the wind as buyers rush in to buy first and ask questions later. Two manias in the last century – the 1920’s “Roaring Twenties” and the 1990’s “Tech Bubble” – show that the sky is the limit when common sense is overcome by a blind desire to buy. But, of course, the piper must be paid and the following decade or two are spent in Secular Bear Markets, giving most or all of the mania gains back.
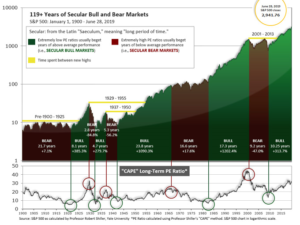
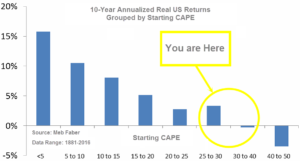
See Fig. 1 for the 100-year view of Secular Bulls and Bears. The CAPE is now at 30.14, up from the prior week’s 29.86, above the level reached at the pre-crash high in October, 2007. Since 1881, the average annual return for all ten year periods that began with a CAPE around this level have been in the 0% – 3%/yr. range. (see Fig. 2).
In the Big Picture:
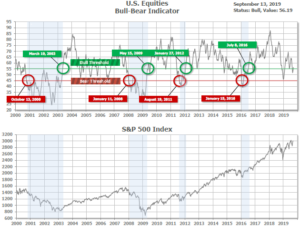
The “big picture” is the months-to-years timeframe – the timeframe in which Cyclical Bulls and Bears operate. The U.S. Bull-Bear Indicator (see Fig. 3) is in Cyclical Bull territory at 56.19, up from the prior week’s 54.11.
In the Intermediate and Shorter-term Picture:
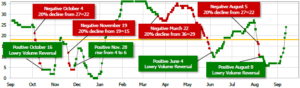
The Shorter-term (weeks to months) Indicator (see Fig. 4) is positive. The indicator ended the week at 24, up sharply from the prior week’s 10. Separately, the Intermediate-term Quarterly Trend Indicator – based on domestic and international stock trend status at the start of each quarter – was positive entering July, indicating positive prospects for equities in the third quarter of 2019.
Timeframe summary:
In the Secular (years to decades) timeframe (Figs. 1 & 2), the long-term valuation of the market is historically too high to sustain rip-roaring multi-year returns. The Bull-Bear Indicator (months to years) remains positive (Fig. 3), indicating a potential uptrend in the longer timeframe. In the intermediate timeframe, the Quarterly Trend Indicator (months to quarters) is positive for Q3, and the shorter (weeks to months) timeframe (Fig. 4) is positive. Therefore, with three indicators positive and none negative, the U.S. equity markets are rated as Positive.
In the markets:
U.S. Markets: U.S. stocks recorded their third consecutive positive week as investors responded to a series of positive market developments. The gains lifted the large cap benchmarks back to within 1% of their all-time highs, but it was the small caps that led the way with substantial gains for the week. The Dow Jones Industrial Average added 422 points last week to finish at 27,219, a gain of 1.6%. The technology-heavy NASDAQ Composite added 0.9%. By market cap, the large cap S&P 500 rose 1.0%, while the S&P 400 mid cap index and small cap Russell 2000 index rose 2.7% and 4.9%, respectively. Not detectable from the headlines, the hidden story of the week was a big jump in value stocks compared to growth stocks. This appeared to be the result of financials – the biggest sector in the value space – catching fire on the back of a large rise in interest rates during the week (see the “Finally” section below).
International Markets: Major international markets were green across the board last week as both the U.S. and China made concessions in their festering trade dispute. Canada’s TSX rose 0.9% while the United Kingdom’s FTSE added 1.2%. On Europe’s mainland, France’s CAC 40 rose 0.9% and Germany’s DAX added 2.3%. In Asia, China’s Shanghai Composite gained 1.1% while Japan’s Nikkei surged 3.7%. As grouped by Morgan Stanley Capital International, developed markets rose 2.2% and emerging markets gained 2.4%.
Commodities: Gold sold off given the strength in the equity markets declining -1.1% to close at $1499.50 an ounce. The often more-volatile Silver declined just over -3% finishing at $17.57 an ounce. Oil finished the week down -3% as West Texas Intermediate crude oil finished the week at $54.85 per barrel. The industrial metal copper, viewed by analysts as a barometer of world economic health due to its wide variety of uses, rose for a third straight week finishing up 2.5%.
U.S. Economic News: The Labor Department reported that the number of Americans seeking first-time unemployment benefits fell to a 5-month low of 204,000 last week. Initial jobless claims fell by 15,000 to its third lowest reading of the current economic expansion that began more than 10 years ago. Economists had expected new claims to total 213,000. The reading remains far below the 300,000 threshold that analysts use to gauge a “robust” jobs market. The less-volatile monthly average of new claims fell by 5,250 to 212,500. That number is near an eight-week low. Continuing claims, which counts the number of people already collecting unemployment benefits, fell by 4,000 to 1.67 million. That number is reported with a one week delay.
Analysts noted that despite a drop in job openings and slower hiring, the labor market remains strong. Their assessment is based on the record number of workers quitting current jobs for presumably more lucrative ones. The share of workers quitting jobs hit its highest level since the Great Recession in August. The so-called “quits rate” rose to 2.6% among private-sector employees. That matched a high reached in 2008. The only time the quits rate has been higher was in 2001. In addition, job openings remain near their highs and easily exceed the 6 million Americans officially classified as unemployed. The U.S. has added an average of 150,000 new jobs a month in the past six months, down from 232,000 in January.
Prices inched up last month for U.S. producers, but broad inflation remained low showing little sign of trouble for the domestic economy. The Bureau of Labor Statistics reported the wholesale cost of goods and services ticked up 0.1% last month. Economists had predicted no increase. Removing the volatile food, energy, and retail-trade margin categories, so-called “core” wholesale inflation rose a sharper 0.4%. The increase in the core rate of wholesale inflation over the past 12 months rose to 1.9% in August from 1.7%. Economists prefer core inflation readings because food, gas and trade margins can swing sharply from month to month and mask underlying price trends. Overall, wholesale inflation has risen 1.8% over the past year, up from 1.7% last month’s year-over-year reading.
Cheaper fuel costs kept inflation in check for U.S. consumers, but rising costs for healthcare and housing indicated underlying price pressures could be building. The consumer price index rose 0.1% last month, matching economists’ forecasts. Over the past year, the cost of living has risen 1.7%, government figures show. However, stripping out the volatile food and energy categories, inflation has accelerated since the beginning of summer. Core inflation rose 0.3% for the third month in a row. Over the past year, the so-called core rate advanced to 2.4% – a 13-month high. The last time the core rate of inflation was higher was in 2008. Chief economist Stephen Stanley of Amherst Pierpont Securities wrote in a note to clients, “It is not clear that inflation fires are breaking out, but we’re starting to see some pretty substantial smoke.”
The optimism of the nation’s small business owners hit a five-month low in August according to the National Federation of Independent Business (NFIB). The NFIB reported its small business optimism index fell 1.6 points to a seasonally-adjusted 103.1 in August, its worst reading since March. In the report, the percentage of owners expecting the economy to improve dropped 8 points, while those expecting real sales to improve fell 5 percent. Only 3 of the sub-components of the optimism index improved, while 7 declined.
In contrast to the NFIB report above, the sentiment among the nation’s consumers rose more than expected in September as consumers felt more confident about both current and future economic conditions, the University of Michigan reported. UofM’s September print on consumer sentiment rose 2.2 points to 92. Economists expected sentiment to rise to just 91. The current economic conditions index also rose to 106.9 from 105.3. Richard Curtin, chief economist of the survey, noted while consumers feel more confident about the economy, worries about the impact of tariffs on the economy increased in early September. Curtin stated 38% of consumers surveyed made “spontaneous references to the negative impact of tariffs, the highest percentage since March 2018.”
International Economic News: The Canadian dollar (CAD – aka the “Loonie”) weakened to a nine-day low against its U.S. counterpart as investors braced for a less-dovish Federal Reserve. Money markets expect the Fed to cut interest rates this coming week, but they have been scaling back the amount of additional easing they see over the coming year. Adam Button, chief currency analyst at ForexLive stated, “The U.S. dollar is in demand because the market increasingly believes that the Federal Reserve won’t cut interest rates as much as previously thought. That is reflected in USD-CAD more than anywhere else.” The decline for the Loonie came as data from Statistics Canada showed that the ratio of Canadian household debt-to-income widened to a record 174.1% in the second quarter from a downwardly revised 172.8% in the first quarter and that the debt service ratio rose to 14.9%. “That means there’s now a reduced share of disposable income left for households to spend on things other than debt servicing,” Krishen Rangasamy, a senior economist at National Bank Financial, said in a note.
Across the Atlantic, a survey of Chief Financial Officers revealed they believe the most likely outcome for the United Kingdom will be a “no-deal” Brexit. Britain and Northern Ireland are set to leave the EU trading bloc on October 31—the third deadline for the UK’s departure after previous extensions were granted. Fears of no deal have been compounded by a new UK government which has reportedly been planning for an abrupt exit while also reducing negotiations with the EU. According to the latest CNBC Global CFO Council quarterly survey, 43.5% of chief financial officers now view “no deal” as the most likely scenario. Almost a third (32.3%) predict a deadline extension, 8.1% expect a deal can be struck by the end of October, 3.2% foresee a second referendum while the remainder (12.9%) are not sure.
On Europe’s mainland, French Finance Minister Bruno Le Maire said Facebook’s proposed cryptocurrency, named “Libra”, poses financial risks and could be open to abuse. Talking about Libra at a meeting for the Organization for Economic Cooperation and Development in Paris, Mr. Le Maire said “This eventual privatization of money contains risks of abuse of dominant position, risks to sovereignty and risks for consumers and for companies. All these concerns about Libra are serious. I therefore want to say with plenty of clarity: in these conditions, we cannot authorize the development of Libra on European soil.” Mr. Le Maire said he had been in touch with both the incoming and outgoing heads of the European Central Bank about setting up a “public digital currency” under the aegis of international financial institutions.
The Institute for the World Economy (IFW) said Germany is on the brink of recession after leading economists cut its gross domestic product (GDP) forecast for the third quarter. IFW estimates Germany’s GDP could contract a further 0.3% in the third quarter, in what would be its worst figure in six years. The predicted downturn comes after the EU’s largest economy slipped into contraction in the second quarter. An economic recession is triggered when GDP falls during two consecutive quarters or six months. The IFW said: “Such weak figures were last seen in 2013 in the wake of the euro debt crisis.”
In Asia, trade tensions between the U.S. and China thawed a bit this week as China announced that it will exclude imports of U.S. soybeans, pork, and other farm goods from additional trade war tariffs. The move opens the door for significant purchases of agricultural products from the U.S. China’s Xinhua News Agency reported China’s National Development and Reform Commission and Ministry of Commerce made the exemption in response to the U.S. decision to postpone its increase in its tariff on $250 billion of Chinese goods from October 1 to October 15. In addition, U.S. President Donald Trump spoke this week on the possibility of an “interim trade deal” that could be struck over the coming week.
Japan’s economy expanded at a slower pace than initially reported in the second quarter. Japan’s Cabinet Office reported gross domestic product grew at an annualized pace of 1.3% in the second quarter, down -0.5% from its preliminary reading of 1.8%. The revision was primarily due to weaker growth in business investment than first thought. The revised figure matched analysts’ median estimate. Economists had expected overall growth to be smaller than first estimated after Finance Ministry figures released last week showed manufacturers cutting back on business investment as escalating trade tensions darken the global outlook.
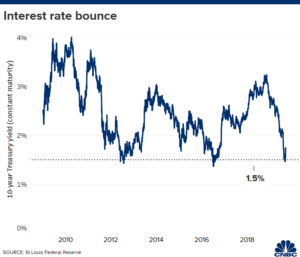
Finally: The 1927 Yankees batting order was famously dubbed “murderers row” due to their lineup stacked with Hall of Famers like Babe Ruth, Lou Gehrig, and Earl Combs. According to Bank of America strategist Michael Hartnett, today’s murderers row is made up of the global central bankers Jerome Powell of the U.S. Federal Reserve, Mario Draghi at the European Central Bank, and Haruhiko Kuroda at the Bank of Japan. In a research note, Hartnett stated coordinated central bank action has reinvigorated the “everything rally” and that fund flow data shows both bond and equity funds saw inflows. While he notes “investors are all in on the bond bubble”, he believes that stance is misguided and spells trouble. He offered what he calls “the most important chart in the world”, which he suggests indicates the bond bubble is about to burst as the yield on the 10-year U.S. Treasury note has consistently failed to remain below 1.5%. Indeed, bond yields bounced once again off the 1.5% level and rallied the most in a single week since autumn of 2016, causing sizeable losses in the interest-rate-sensitive sectors of utilities and real estate, and equally sizeable gains in financials and some other “value” sectors.
(Sources: all index return data from Yahoo Finance; Reuters, Barron’s, Wall St Journal, Bloomberg.com, ft.com, guggenheimpartners.com, zerohedge.com, ritholtz.com, markit.com, financialpost.com, Eurostat, Statistics Canada, Yahoo! Finance, stocksandnews.com, marketwatch.com, wantchinatimes.com, BBC, 361capital.com, pensionpartners.com, cnbc.com, FactSet) Securities offered through Registered Representatives of Cambridge Investment Research Inc., a broker-dealer, member FINRA/SIPC. Advisory Services offered through Cambridge Investment Research Advisors, a Registered Investment Adviser. Strategic Investment Partners and Cambridge are not affiliated.
Indices mentioned are unmanaged and cannot be invested into directly. Past performance is no guarantee of future results. All Investing involves risk. Depending on the types of investments, there may be varying degrees of risk. Investors should be prepared to bear loss, including total loss of principal.