9-7-20 Weekly Market Update
The very Big Picture
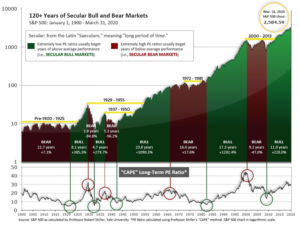
The long-term valuation of the market is commonly measured by the Cyclically Adjusted Price to Earnings ratio, or “CAPE”, which smooths-out shorter-term earnings swings in order to get a longer-term assessment of market valuation. A CAPE level of 30 is considered to be the upper end of the normal range, and the level at which further PE-ratio expansion comes to a halt (meaning that further increases in market prices only occur as a general response to earnings increases, instead of rising “just because”). The market was recently at that level.
Of course, a “mania” could come along and drive prices higher – much higher, even – and for some years to come. Manias occur when valuation no longer seems to matter, and caution is thrown completely to the wind – as buyers rush in to buy first, and ask questions later. Two manias in the last century – the “Roaring Twenties” of the 1920s, and the “Tech Bubble” of the late 1990s – show that the sky is the limit when common sense is overcome by a blind desire to buy. But, of course, the piper must be paid, and the following decade or two were spent in Secular Bear Markets, giving most or all of the mania-gains back.

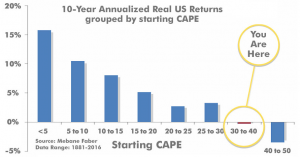
See Fig. 1 for the 100-year view of Secular Bulls and Bears. The CAPE is now at 31.47, down from the prior week’s 32.28. Since 1881, the average annual return for all ten-year periods that began with a CAPE in the 25-35 range have been slightly-positive to slightly-negative (see Fig. 2).

Note: We do not use CAPE as an official input into our methods. However, if history is any guide – and history is typically ‘some’ kind of guide – it’s always good to simply know where we are on the historic continuum, where that may lead, and what sort of expectations one may wish to hold in order to craft an investment strategy that works in any market ‘season’ … whether current one, or one that may be ‘coming soon’!
The Big Picture:
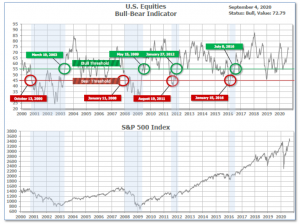
The ‘big picture’ is the (typically) years-long timeframe – the timeframe in which Cyclical Bulls and Bears operate. The U.S. Bull-Bear Indicator is in Cyclical Bull territory at 72.79 down from the prior week’s 74.49.

In the Quarterly- and Shorter-term Pictures
The Quarterly-Trend Indicator based on the combination of U.S. and International Equities trend-statuses at the start of each quarter – was Positive entering July, indicating positive prospects for equities in the third quarter of 2020. (On the ‘daily’ version of the Quarterly-Trend Indicator, where the intra-quarter status of the Indicator is subject to occasional change, both the U.S. Equities and International Equities readings remain in ‘Down’ status; the daily International reading turned to Down on Thursday, Feb. 27th; the U.S. daily reading turned to Down on Friday, Feb. 28th.)
Next, the short-term(weeks to months) Indicator for US Equities turned negative on September 3rd and ended the week at 23, down from the prior week’s 29.

In the Markets:
U.S. Markets: U.S. stocks finished the week lower as investors suddenly took profits on Thursday and Friday after setting new all-time highs on Wednesday on several benchmark indexes. The technology-heavy NASDAQ Composite index suffered the deepest decline, giving up more than 3% on the week, but still remains comfortably up year-to-date. The Dow Jones Industrial Average tumbled by more than 500 points to finish the week at 28,133, a decline of -1.8%. The NASDAQ capped five consecutive weeks of gains with a -3.3% decline. By market cap, the large cap S&P 500 retreated ‑2.3%, while the mid cap S&P 400 and small cap Russell 2000 declined -2.5% and -2.7%, respectively.
International Markets: Canada’s TSX declined -2.9% and the United Kingdom’s FTSE 100 gave up -2.8%. On Europe’s mainland, France’s CAC 40 declined -0.8%, Germany’s DAX fell -1.5%, and Italy’s Milan FTSE retreated -2.3%. In Asia, China’s Shanghai Composite ended down -1.4%, while Japan’s Nikkei was the lone major market winner, gaining 1.4%. As grouped by Morgan Stanley Capital International, developed markets fell -1.5%, while emerging markets declined a steeper -2.7%.
Commodities: Precious metals were unable to finish the week in the green despite the weakness in the equities markets. Gold declined -2.1% to $1934.30 an ounce, while Silver finished the week at $26.71 per ounce, a decline of -3.9%. Oil, too, finished the week down after four consecutive weeks of gains. West Texas Intermediate crude oil fell -7.5% to $39.77 per barrel. On the other hand, the industrial metal copper, viewed by analysts as a barometer of global economic health due to its wide variety of uses, finished up for a fourth straight week rising 1.4%.
August Summary: Among U.S. equities, the NASDAQ Composite led the way with a 6.8% monthly gain. That was followed by the S&P 500, up 5.5%, mid caps, up 4.5%, and small caps up 2.7%. The Dow was the laggard, rising “just” 2.4%. In International markets, Canada rose 4.2%, while the UK declined -4.4%. France declined -3.1%, Germany ended the month flat, and Italy ended down -1.5%. China surged 10.9% but Japan declined -2.6%. Emerging markets rallied 8.3% while developed markets gained 1.9%. In commodities, Silver led the way with a big 18% gain, while Copper added 6.7% and Oil rose 5.8%. Gold, however, finished the month down -0.4%.
U.S. Economic News: The number of Americans seeking first-time unemployment benefits fell sharply last week to a new pandemic low. The Labor Department reported initial jobless claims fell by 130,000 to a seasonally-adjusted 881,000 in the last week of August. Economists had expected 940,000 new claims. It was the fifth consecutive week in which unadjusted claims have been below one million. Still, jobless claims remain exceedingly high. They averaged in the low 200,000s and stood near a half-century low just before the coronavirus pandemic broke out in February. Continuing claims, which counts the number of people already receiving benefits, fell to a seasonally-adjusted 13.25 million from 14.49 million in the week ended August 22. That number is reported with a one-week delay.
The jobs recovery from the pandemic continued in August, but at a slower pace. Nonfarm payrolls expanded by 1.4 million in August, 50,000 above the consensus. However, the big story in the release was the surprisingly large drop in the unemployment rate from 10.2% to 8.4%. The decline marked the fourth consecutive decline from the pandemic peak of 14.7%. “I would say today’s jobs report was a good one,” Federal Reserve Chairman Jerome Powell stated in an interview. The U.S. shed more than 22 million jobs during the worst of the pandemic. So far it has restored about 10.7 million jobs, leaving about half of the people who were laid off still out of work. A broader measure of unemployment known as the U6 rate suggests the “real” rate was 14.2% in August, down from 16.5% in the prior month. The U6 rate includes workers who can only find part-time work and those who have become discouraged.
The services sector, which makes up the vast majority of the U.S. economy, expanded again in August—but companies still haven’t brought back most of their workers amid the uncertainty of the coronavirus. The Institute for Supply Management (ISM) reported its index of non-manufacturing companies—retailers, banks, hospitality, healthcare providers and the like—slipped to 56.9 in August, from 58.1 in July. Readings above 50 indicate growth rather than contraction. The reading was only slightly below the consensus of 57.0. In the report, new orders and production both grew more slowly in August, but they still showed a marked improvement from several months ago. Employment levels, meanwhile, continued to stabilize after massive layoffs and furloughs earlier in the year. ISM’s employment gauge rose to 47.9 from 42.1, marking the highest level since the pandemic began in March.
Manufacturing activity increased for a fourth consecutive month, according to the latest data from the Institute for Supply Management (ISM). ISM reported that its manufacturing index climbed 1.8 points to a 21-month high of 56.0. Economists had expected a reading of 55.0. The reading implies a continued recovery from the pandemic lows in both manufacturing output and the broader economy. Four of the five ISM index components increased last month, led by a 6.1-point jump in new orders to 67.6, the highest level since January 2004. Furthermore, production increased at its fastest pace since the beginning of 2018. Similarly, research firm Markit reported its U.S. Manufacturing Purchasing Managers’ Index (PMI) rose 2.2 points in August to 53.1—its highest level since January 2019. Markit reported strong upturns in output and new orders, boosted by firmer export orders.
The Commerce Department reported that factory orders jumped 6.4% in July, the third consecutive increase. Economists had expected an increase of 6.2%. Durable goods, products expected to last at least 3 years, were revised up to 11.4% from 11.2%, led by transportation equipment. Orders for nondefense capital goods ex-aircraft, a proxy for capital expenditures, rose 1.9% also up a third straight month. Nondurable goods rose 1.8%, led by petroleum products. On a year-over-year trend basis, factory orders were down 10.9%, but the negative momentum has abated since May.
The Federal Reserve’s ‘Beige Book’, a collection of anecdotes from each of the Federal Reserve’s member banks, softened in August as many parts of the country expanded at slower pace of growth and reported lingering anxiety over the coronavirus. “Continued uncertainty and volatility related to the pandemic, and its negative effect on consumer and business activity, was a theme echoed across the country,” the central bank’s Beige Book reported. Nonetheless, the Fed said manufacturers in most of the country grew again. Consumer spending on houses and new cars and trucks were also bright spots. Yet total spending by both businesses and consumers was still well below pre-crisis levels. Energy producers and farmers in particular suffered from low prices and little prospect of any improvement soon.
International Economic News: A new poll showed Canadians’ confidence in their economy took a dramatic dive over the summer in the midst of the COVID-19 pandemic. A multi-national survey by the Pew Research Center reported 61% of Canadians described the country’s current economic situation as “bad”–more than double the amount who said the same thing last year. The center stated, “The sharpest uptick in negative assessments has come in Canada, where second-quarter losses in gross domestic product were estimated at 12%”. In the details of the survey, less than half (48%) of Canadians stated they expect the economy to improve over the next 12 months, while 17% predicted no change.
Across the Atlantic, a Bank of England policymaker stated fresh action would be needed to support Britain’s economy as it emerges from the pandemic lockdown. Michael Saunders, one of the nine members of the Bank of England’s interest rate-setting monetary policy committee, said he expected unemployment to rise rapidly as the Treasury scaled back its help and people returned to look for work. “The economy’s faster than expected rebound in the last few months has reflected a benign window in which large fiscal support has coincided with the relaxation of lockdown measures and low infection rates. This window may now be closing,” Saunders said. Britain’s economy shrank by more than 20% in the April-June period, worse than any other big industrialized nation.
Facing resurgent virus infections, the government of France unveiled details of a 100 billion euro ($118 billion) recovery plan aimed at creating jobs and saving struggling businesses. Prime Minister Jean Castex told reporters, “The ambition and size of this plan are historic.” Called “France Reboot”, the plan includes injecting money to bring back manufacturing of medical supplies to French factories, to develop hydrogen energy, to train young people for 21st century jobs and to hire more staff at unemployment offices. The stimulus equates to 4% of gross domestic product, meaning France is injecting more public cash into its economy than any other big European country as a percentage of GDP.
Germany is expecting a V-shaped economic rebound following the coronavirus pandemic. Germany’s economy is recovering faster than anticipated, helped by a mild and short coronavirus lockdown, a large-scale fiscal stimulus, and Berlin’s close trade links with China according to government assessments. The country’s economy ministry said Germany’s GDP should contract by -5.8% this year, a 0.5% percentage point improvement from earlier forecasts. Germany’s light lockdown left most factories and offices open while heavy government spending helped compensate furloughed workers. Europe’s largest economy, traditionally reliant on international trade, is also benefiting from a marked rebound in China and other Asian countries. Exports to China, Germany’s largest trading partner, increased by 15.4% in June compared with the same month a year earlier, the Federal Statistics Office said.
In light of rising tensions between Beijing and Washington, China announced it may gradually cut its holdings of U.S. Treasury bonds. Xi Junyang, a professor at the Shanghai University of Finance and Economics stated, “China will gradually decrease its holdings of U.S. debt to about $800 billion under normal circumstances.” Junyang added, “But of course, China might sell all of its U.S. bonds in an extreme case, like a military conflict.” China is the second largest non-U.S. holder of Treasuries, holding $1.074 trillion in June, according to the latest official data. China has already decreased its holdings of U.S. bonds this year. Analysts note large-scale Chinese selling of treasuries could trigger turmoil in global financial markets, which would benefit no one.
Outgoing Japanese Prime Minister Shinzo Abe announced last week he was stepping down for health reasons, leaving much to do to revive the world’s third-largest economy. Chief Cabinet Secretary Yoshihide Suga has emerged as the front-runner to be Japan’s next prime minister. Suga has said he would “maintain and push forward” with Abenomics, which involve large-scale monetary policy easing, fiscal spending and structural reform. However, analysts note that regardless of who ultimately takes the position, the coronavirus pandemic has left little room for the government to make drastic policy changes. That’s important to investors, said Kathy Matsui, vice chair and chief Japan strategist at Goldman Sachs. “From the perspective of markets, investors are looking for stability, continuity,” she wrote.
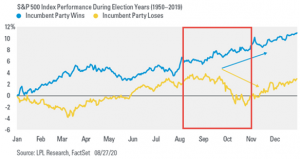
Finally: Ryan Detrick, chief market strategist at LPL Financial, published a study this week in which he said a simple equity-market chart has been the best predictor of U.S. presidential elections since 1984, proving 100% accurate—and is 87% accurate since 1928.The LPL analyst says that a chart of the S&P 500’s performance in the three-month period ahead of Election Day, which is Nov. 3 this year, has proven accurate over the past nearly four decades. If the S&P 500 declines during this 3-month stretch, the incumbent party loses, but if the S&P 500 rises during this 3-month period, the incumbent party wins. (Chart from LPL Financial)

(Sources: All index- and returns-data from Yahoo Finance; news from Reuters, Barron’s, Wall St. Journal, Bloomberg.com, ft.com, guggenheimpartners.com, zerohedge.com, ritholtz.com, markit.com, financialpost.com, Eurostat, Statistics Canada, Yahoo! Finance, stocksandnews.com, marketwatch.com, wantchinatimes.com, BBC, 361capital.com, pensionpartners.com, cnbc.com, FactSet.) Securities offered through Registered Representatives of Cambridge Investment Research Inc., a broker-dealer, member FINRA/SIPC. Advisory Services offered through Cambridge Investment Research Advisors, a Registered Investment Adviser. Strategic Investment Partners and Cambridge are not affiliated. Indices mentioned are unmanaged and cannot be invested into directly. Past performance is no guarantee of future results.
