
9-14-20 Weekly Market Update
The very Big Picture
The long-term valuation of the market is commonly measured by the Cyclically Adjusted Price to Earnings ratio, or “CAPE”, which smooths-out shorter-term earnings swings in order to get a longer-term assessment of market valuation. A CAPE level of 30 is considered to be the upper end of the normal range, and the level at which further PE-ratio expansion comes to a halt (meaning that further increases in market prices only occur as a general response to earnings increases, instead of rising “just because”). The market was recently at that level.
Of course, a “mania” could come along and drive prices higher – much higher, even – and for some years to come. Manias occur when valuation no longer seems to matter, and caution is thrown completely to the wind – as buyers rush in to buy first, and ask questions later. Two manias in the last century – the “Roaring Twenties” of the 1920s, and the “Tech Bubble” of the late 1990s – show that the sky is the limit when common sense is overcome by a blind desire to buy. But, of course, the piper must be paid, and the following decade or two were spent in Secular Bear Markets, giving most or all of the mania-gains back.
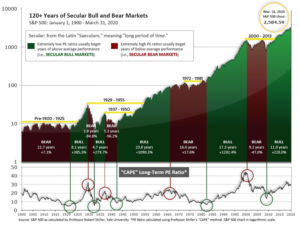
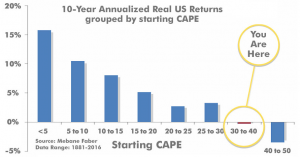
See Fig. 1 for the 100-year view of Secular Bulls and Bears. The CAPE is now at 30.68, down from the prior week’s 31.47. Since 1881, the average annual return for all ten-year periods that began with a CAPE in the 25-35 range have been slightly-positive to slightly-negative (see Fig. 2).
Note: We do not use CAPE as an official input into our methods. However, if history is any guide – and history is typically ‘some’ kind of guide – it’s always good to simply know where we are on the historic continuum, where that may lead, and what sort of expectations one may wish to hold in order to craft an investment strategy that works in any market ‘season’ … whether current one, or one that may be ‘coming soon’!
The Big Picture:
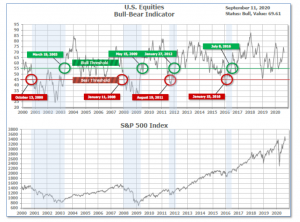
The ‘big picture’ is the (typically) years-long timeframe – the timeframe in which Cyclical Bulls and Bears operate. The U.S. Bull-Bear Indicator is in Cyclical Bull territory at 69.61 down from the prior week’s 72.79.
In the Quarterly- and Shorter-term Pictures
The Quarterly-Trend Indicator based on the combination of U.S. and International Equities trend-statuses at the start of each quarter – was Positive entering July, indicating positive prospects for equities in the third quarter of 2020. (On the ‘daily’ version of the Quarterly-Trend Indicator, where the intra-quarter status of the Indicator is subject to occasional change, both the U.S. Equities and International Equities readings remain in ‘Down’ status; the daily International reading turned to Down on Thursday, Feb. 27th; the U.S. daily reading turned to Down on Friday, Feb. 28th.)
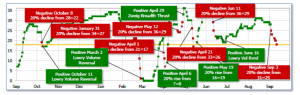
Next, the short-term(weeks to months) Indicator for US Equities turned negative on September 3rd and ended the week at 18, down from the prior week’s 23.
In the Markets:
U.S. Markets: U.S.stocks pulled back further from recent highs in a shortened but highly volatile trading week. The technology-heavy NASDAQ Composite index fared the worst, declining -4.1% and ending the week in correction territory—down 10% or more from the all-time high it reached on September 2nd. The Dow Jones Industrial Average shed 467 points finishing the week at 27,665, a decline of -1.7%. By market cap, the large cap S&P 500 retreated -2.5%, while the mid cap S&P 400 index and small cap Russell 2000 indexes declined -2.3% and -2.5%, respectively.
International Markets: Canada’s TSX ticked up 0.03%, while the United Kingdom’s FTSE 100 rallied 4.0%. On Europe’s mainland, France’s CAC 40 rose 1.4%, Germany’s DAX added 2.8%, and Italy’s Milan FTSE tacked on 2.2%. In Asia, China’s Shanghai Composite retreated -2.8%. Japan’s Nikkei finished the week up 0.9%. As grouped by Morgan Stanley Capital International, developed markets rose 0.4% while emerging markets declined -0.9%.
Commodities: Precious metals rose in response to the weakness in the equities markets. Gold added $13.60 to finish the week at $1947.90 per ounce, a gain of 0.7%. Silver added 0.5% and finished at $26.86 per ounce. Oil sold off for a second consecutive week. West Texas Intermediate crude oil declined -6.1% to $37.33 per barrel. The industrial metal copper, viewed by some analysts as a barometer of world economic health, finished the week down -0.7%.
U.S. Economic News: The number of Americans filing first-time unemployment benefits remained higher than expected in early September for the fourth consecutive week, signaling that the gradual improvement in the labor market over the summer has stalled. The Labor Department reported initial jobless claims remained unchanged at an upwardly revised 884,000 last week, above the consensus of 850,000. While it was the lowest number of initial claims in nearly six months, it was still higher than in any recession since 1967, highlighting the devastation the pandemic has inflicted on the economy. Continuing claims, which counts the number of Americans already receiving benefits, rose 93,000 to 13.385 million. That was its first increase in five weeks.
The Labor Department reported the number of job openings rose again in July, a sign that labor demand is firming. The Labor Department reported job openings rose by 617,000 to 6.6 million in July. For comparison, the number of jobs available were running around 7 million a month before the pandemic hit. There were notable gains in retail trade, health care, social assistance, and construction jobs. Hires, however, sank by 17.0% to 5.787 million, led by a significant decline in accommodation and food service jobs as that industry remains under severe pressure from COVID-19. On the positive side, layoffs fell to 1.721 million—its lowest level since March of last year.
Optimism of small business owners picked up in August, its third increase in the last four months. The National Federation of Independent Business (NFIB) survey rose 1.4 points to 100.2. The reading is a marked improvement from the pandemic low in April, boosted by Paycheck Protection Program loans and other fiscal help. Still, the reading remains 4.3 points below its level in February. Seven of the ten NFIB components improved last month, led by the earnings trend. Current inventory satisfaction was at its highest level since February 1997, while current job openings and hiring plans for the next three months both picked up.
For the second consecutive month, consumers increased their borrowing for big ticket items like vehicles and college tuition. In the latest report from the Federal Reserve, the use of credit rose in July after slumping from March through May. Outstanding consumer debt rose by $12.3 billion in July from the prior month, marking a 3.6% increase. Credit rose at a revised 3.3% annual clip in June. The use of credit had sunk nearly 20% in April during the worst of the pandemic. Revolving credit, such as credit cards, fell in July at a 0.4% annual rate—its fifth straight decline. Non-revolving credit, typically auto and student loans, climbed by 4.8% and rose for a third month in a row. Non-revolving credit is more stable and less prone to sharp swings like the use of credit cards.
Prices at the wholesale level ticked up a seasonally-adjusted 0.3% in August. The rise follows a 0.6% increase in July. Economists had expected a 0.2% increase. Ex-food and energy, so-called “core PPI” increased 0.4%–also above expectations. The increase in producer prices was led by services, which advanced 0.5%, the same as in the previous month, resulting in the biggest back-to-back jump since data began in 2009. Year-over-year, PPI for final demand was off -0.2%, its fifth consecutive decline, while core PPI edged up 0.6%. Neither measure is indicating any significant inflationary momentum.
At the consumer level, prices firmed slightly rising 0.4% in August, its third consecutive gain. Analysts had expected an increase of 0.3%. Core CPI, which excludes food and energy, also rose 0.4%. The increase was primarily attributed to a surge in the price of used cars and trucks, which jumped 5.4%, their biggest increase since March of 1969. The increase in used vehicle prices was responsible for 40% of the rise in core CPI. There were also notable price gains in recreation, apparel, car insurance, and airline fares. Year-over-year, the CPI increased 1.3%, while core rose 1.7%. Both have firmed over the past four months from near-deflation territory, but continue to show subdued price pressures and remain well-below the Federal Reserve’s inflation target of 2.0%. Both producer and core CPI reports suggest that Fed policy will continue to remain accommodative for the foreseeable future.
International Economic News: The Bank of Canada said the economic recovery from COVID-19 will need help from policymakers and reiterated its intention to keep its key benchmark interest rate at 0.25% for as long as necessary. The move to hold the bank’s benchmark rate—known as the target for the overnight rate—was widely expected by economists. Like most countries, Canada’s economy plunged into recession in March when COVID-19 prompted widespread lockdowns. Since then, Canada’s economy has staged a remarkable recovery. A bank spokesman stated, “The bank continues to expect this strong reopening phase to be followed by a protracted and uneven recuperation phase, which will be heavily reliant on policy support.”
The United Kingdom’s Office for National Statistics (ONS) reported the UK economy grew 6.6% in July on a monthly basis, according to initial estimates. July’s estimated growth in GDP was broadly in line with expectations. The reading follows growth of 8.7% in June and 2.4% in May. April saw a record plunge of 20%. Compared to the same time last year, GDP showed a decline of -11.7%. ONS Director of Economic Statistics Darren Morgan stated, “While it has continued steadily on the path towards recovery, the UK economy still has to make up nearly half of the GDP lost since the start of the pandemic.”
On Europe’s mainland, France is set to close its economic gap with Germany that opened up because of differences in how the countries measured the impact of the coronavirus lockdown on their public sectors, economists said. The French economy shrank by almost 19% in the first six months of the year, dragged down by the sharp drop in activity in its vast public sector. Germany’s economy contracted 11.5% in the same period. Gilles Moec, chief economist at French insurer Axa, said the drop in public sector activity was “a significant issue” after it knocked 2.5% off the country’s gross domestic product in the second quarter, while it boosted Germany’s economy 0.3%. However, as the economy recovers, the same effect should lift France’s third-quarter GDP by 3.9%. “This would offset quite some of the differential with Germany,” Moec added.
In Asia, asset manager Amundi stated world economies are still “several quarters” away from returning to pre-coronavirus levels, while China is anticipated to return to a full rebound by the end of the year. Amundi noted data from China shows that the economy experienced continued recovery in its manufacturing and service sectors, and GDP in the second-quarter grew by 3.2%— a sign that it may be on track towards a V-shaped recovery. Conversely, other economies saw record declines in the second quarter.
Sentiment among workers in Japan with jobs sensitive to economic trends continued to improve in August, hitting its highest level in 11 months as economic activities continued to pick up. Japan’s Cabinet Office reported its diffusion index of confidence among “economy watchers” like taxi drivers and restaurant staff, rose 2.8 points to 43.9. The latest reading was the fourth consecutive month of increases of retail, housing, manufacturing, and employment related indexes all showing notable increases. A Japanese cabinet official said that the declining trend of new daily infections was believed to have lifted respondents’ views.
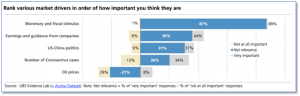
Finally: What would have been labeled as a “conspiracy theory” just a few short years ago is now a generally accepted fact, a recent study by UBS shows. A survey by the firm showed that when it comes to belief in what drives financial markets, respondents overwhelmingly believe that nothing matters more than the Fed. UBS strategists led by Bhanu Baweja stated that in the present market environment, “There was overwhelming consensus that monetary and fiscal stimulus was the most important driver for markets.” Nothing else was even close. Coranavirus ranked fourth.
(Sources: All index- and returns-data from Yahoo Finance; news from Reuters, Barron’s, Wall St. Journal, Bloomberg.com, ft.com, guggenheimpartners.com, zerohedge.com, ritholtz.com, markit.com, financialpost.com, Eurostat, Statistics Canada, Yahoo! Finance, stocksandnews.com, marketwatch.com, wantchinatimes.com, BBC, 361capital.com, pensionpartners.com, cnbc.com, FactSet.) Securities offered through Registered Representatives of Cambridge Investment Research Inc., a broker-dealer, member FINRA/SIPC. Advisory Services offered through Cambridge Investment Research Advisors, a Registered Investment Adviser. Strategic Investment Partners and Cambridge are not affiliated. Indices mentioned are unmanaged and cannot be invested into directly. Past performance is no guarantee of future results.