
8-30-20 Weekly Market Update
The very Big Picture
The long-term valuation of the market is commonly measured by the Cyclically Adjusted Price to Earnings ratio, or “CAPE”, which smooths-out shorter-term earnings swings in order to get a longer-term assessment of market valuation. A CAPE level of 30 is considered to be the upper end of the normal range, and the level at which further PE-ratio expansion comes to a halt (meaning that further increases in market prices only occur as a general response to earnings increases, instead of rising “just because”). The market was recently at that level.
Of course, a “mania” could come along and drive prices higher – much higher, even – and for some years to come. Manias occur when valuation no longer seems to matter, and caution is thrown completely to the wind – as buyers rush in to buy first, and ask questions later. Two manias in the last century – the “Roaring Twenties” of the 1920s, and the “Tech Bubble” of the late 1990s – show that the sky is the limit when common sense is overcome by a blind desire to buy. But, of course, the piper must be paid, and the following decade or two were spent in Secular Bear Markets, giving most or all of the mania-gains back.
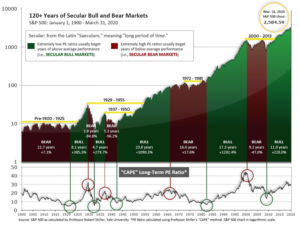
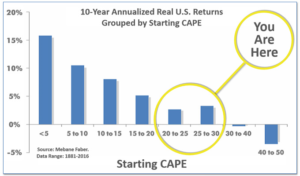
See Fig. 1 for the 100-year view of Secular Bulls and Bears. The CAPE is now at 32.28, up from the prior week’s 31.26. Since 1881, the average annual return for all ten-year periods that began with a CAPE in the 25-35 range have been slightly-positive to slightly-negative (see Fig. 2).
Note: We do not use CAPE as an official input into our methods. However, if history is any guide – and history is typically ‘some’ kind of guide – it’s always good to simply know where we are on the historic continuum, where that may lead, and what sort of expectations one may wish to hold in order to craft an investment strategy that works in any market ‘season’ … whether current one, or one that may be ‘coming soon’!
The Big Picture:
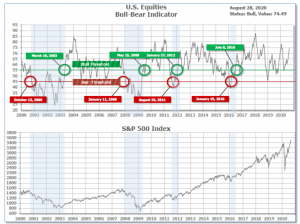
The ‘big picture’ is the (typically) years-long timeframe – the timeframe in which Cyclical Bulls and Bears operate. The U.S. Bull-Bear Indicator is in Cyclical Bull territory at 74.49 up from the prior week’s 72.55.
In the Quarterly- and Shorter-term Pictures
The Quarterly-Trend Indicator based on the combination of U.S. and International Equities trend-statuses at the start of each quarter – was Positive entering July, indicating positive prospects for equities in the third quarter of 2020. (On the ‘daily’ version of the Quarterly-Trend Indicator, where the intra-quarter status of the Indicator is subject to occasional change, both the U.S. Equities and International Equities readings remain in ‘Down’ status; the daily International reading turned to Down on Thursday, Feb. 27th; the U.S. daily reading turned to Down on Friday, Feb. 28th.)
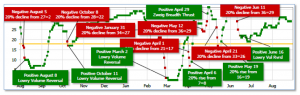
Next, the short-term(weeks to months) Indicator for US Equities remained positive since June 16 and ended the week at 30, down from the prior week’s 31.
In the Markets:
U.S. Markets: U.S. stocks continued to grind higher on largely positive news flow about potential vaccines and treatments for COVID-19. Continuing the recent prevailing trend, higher-valuation growth stocks outperformed lower-priced value companies and large-cap companies easily outpaced small-caps. The Dow Jones Industrial Average added 724 points finishing the week at 28,654, a gain of 2.6%. The technology-heavy NASDAQ Composite rose for a fifth consecutive week, gaining 3.4%. By market cap, the large cap S&P 500 added 3.3%, while the mid cap S&P 400 and small cap Russell 2000 indexes finished up 1.9% and 1.7%, respectively.
International Markets: Canada’s TSX rose 1.1%, while the United Kingdom’s FTSE 100 finished down for a second week, giving up -0.6%. On Europe’s mainland, France’s CAC 40 and Germany’s DAX gained 2.2% and 2.1%, respectively, while Italy’s Milan FTSE added 0.7%. In Asia, China’s Shanghai Composite rose 0.7%. Japan’s Nikkei declined for a second week, finishing down -0.2%. As grouped by Morgan Stanley Capital International, developed markets rose 1.6%, while emerging markets rose 2.9% – the fifth consecutive week of gains for emerging markets.
Commodities: Precious metals finished the week to the upside. Gold rose $27.90 to $1974.90 an ounce, a gain of 1.4%. Silver had its second week of gains, rising 4% to $27.79 an ounce. Oil rose for a fourth consecutive week, rising 1.5% to $42.97 a barrel for West Texas Intermediate crude. The industrial metal copper, seen by analysts as a barometer of global economic health due to its wide variety of uses, rose 3.5% – its third consecutive week of gains.
U.S. Economic News: The number of Americans seeking first-time unemployment benefits fell last week, resuming its downward trend. The Labor Department reported initial jobless claims declined by 98,000 to 1 million matching the consensus forecast. Continuing claims, which counts the number of Americans already receiving benefits, dropped by 223,000 to 14.54 million—another pandemic low. It was its fourth straight decline. Rubeela Farooqi, chief U.S. economist at High Frequency Economics wrote in a note to clients, “The risk of permanent damage to the labor market remains high, which will slow the pace of recovery. The return to pre-pandemic levels of prosperity is set to be an uncertain and prolonged process.”
Home prices continued to rise at a steady clip in June, according to the latest data from S&P Case-Shiller. The S&P CoreLogic Case-Shiller 20-city price index is up 3.5% compared to the same time last year. That’s down a tick from the previous month. On a monthly basis, the index increased 0.2% between May and June. Separately, the national index showed a 4.3% increase in home prices across the country over the past year. That remained unchanged from the rate of price growth in May. In the report, Phoenix continued to lead all nationwide with a 9% annual price gain in May, followed by Seattle (up 6.5%) and Tampa (up 5.9%). Craig Lazzara, managing director and global head of index investment strategy at S&P Dow Jones Indices, wrote in the report, “As has been the case for the last several months, prices were particularly strong in the Southeast and West, and comparatively weak in the Midwest and (especially) Northeast.”
The number of homes in which a contract has been signed but not yet closed rose last month according to the latest data from the National Association of Realtors (NAR). The NAR reported pending home sales rose 5.9% in July compared to June. It was the third consecutive increase in pending home sales. Furthermore, home sales are going under contract in record time, the trade group reported. Compared with a year ago, contract signings were up 15.5%. “We are witnessing a true V-shaped sales recovery as homebuyers continue their strong return to the housing market,” Lawrence Yun, the National Association of Realtors’ chief economist, said in the report.
Sales of new single-family homes increased for the third consecutive month, the U.S. Census Bureau reported. New single-family home sales rose 14% in July to a seasonally-adjusted annual rate of 901,000. Compared with the same time last year, new home sales were up 36%. Economists had expected a median pace of new home sales of 790,000. The surge in sales was driven by a nearly 59% increase in the Midwest month-over-month. Sales also increased on a monthly basis in the South and the West, but fell by 23% in the Northeast. The median sales price in July was $330,600, up 7% from a year ago. The inventory of new homes fell to just 299,000, representing a 4-month supply. That’s down from a 4.6-month supply in June. A 6-month supply is generally considered a balanced housing market.
Confidence among the nation’s consumers fell to a new pandemic low following a resurgence of coronavirus cases. The Conference Board reported its index of Consumer Confidence sank 6.9 points to a six-year low of 84.8 this month. Economists had expected the index to rise to 93.0. Analysts believe the unexpected plunge may be due to the expiration of the $600 per week federal unemployment stipend. President Trump has since authorized temporary $300 payments, but not every state is providing the money. A pair of other consumer surveys, meanwhile, seem to suggest confidence is starting to mend again. The consumer sentiment index produced by the University of Michigan edged up slightly in August, though it was still quite low. And the daily tracker by Morning Consult has been creeping higher in the past two weeks.
Orders for goods expected to last at least three years, so-called “durable goods”, surged last month on strong demand for cars and trucks. The Commerce Department reported Durable-goods orders rose 11.2% in July due to strong consumer demand for cars and trucks. However, analysts noted spending outside the auto industry was softer and the pace of investment slowed. The increase easily topped economists’ forecasts of a 4.8% increase. New orders ex‑transportation orders rose a smaller 2.4%. Auto sales have been surprisingly strong during the summer as Americans took advantage of low interest rates and discounted pricing. Bookings in July were actually higher last month compared to July 2019.
Data from the Chicago Fed showed that economic activity across the country fell last month, from a revised record high in June. The Chicago Federal Reserve reported its National Activity Index declined to 1.18 in July, although its three-month moving average rose into expansion to 3.59 from -2.78 the prior month. The index is designed so that a zero value indicates the national economy is expanding at its historic trend rate of growth. The Chicago Fed index is a weighted average of 85 economic indicators. In the report, fifty-six made positive contributions in July. Production-related indicators contributed 1.09 to the overall index in July, down from 2.21 in the prior month while employment-related indicators added 0.38, down from 1.94 in June.
At its latest Jackson Hole conference, the Federal Reserve laid out a new strategy that allows inflation to run higher than traditional levels, a move widely seen as leading to an easier monetary stance over time. In its new policy framework, agreed to by all 17 top officials, the central bank stated, “The Committee seeks to achieve inflation that averages 2% over time and therefore judges that, following periods when inflation has been running persistently below 2%, appropriate monetary policy will likely aim to achieve inflation moderately above 2% for some time.” The Fed also removed its bias against strong labor markets. In his speech, Powell announced the changes, saying “a robust job market can be sustained without causing an outbreak in inflation.”
International Economic News: Canada’s national statistics agency ‘Statistics Canada’ reported its economy shrank at its fastest pace on record in the second quarter. Canada’s economy contracted by 11.5% in the 3 months between April and June as consumer spending, business investment, and imports and exports all dried up due to COVID-19. That’s an annualized 38.7% pace of contraction, far and away the steepest and fastest decline on records that date back to 1961. Furthermore, the reading was twice as bad as the lowest point hit during the Great Financial Crisis in 2008-2009 when the worst quarterly GDP came in at -4.7%. However, on a positive note, the reading was better than the consensus forecast of a 12% contraction and the numbers for June specifically make that month the biggest rebound on record.
The United Kingdom plunged into the deepest recession of all major economies during the pandemic. UK economic output shrank by 20.4% in the second quarter, the worst quarterly slump on record. The crash in GDP is the worst quarterly decline since records began in 1955. “Today’s figures confirm that hard times are here,” UK finance minister Rishi Sunak said in a statement. Compared with the end of 2019, UK economic output fell by a cumulative 22.1% in the first six months of 2020, a worse outcome than Germany, France and Italy, and more than double the 9.5% fall recorded in the United States, the Office for National Statistics said.
On Europe’s mainland France recorded its biggest daily rise in coronavirus infections since March as President Emmanuel Macron raised the possibility of another nationwide lockdown. A further 7,379 cases were confirmed on Friday, bringing the country’s total to 267,077. It was the largest daily spike since March 31, when 7,578 cases were tallied at the peak of the first wave. France was seeing an “exponential” rise in cases, the health ministry said. Despite the sharp rise, hospital numbers and daily deaths were relatively stable, as young people less severely affected by the disease make up most of the new infections, the ministry said.
Like most countries around the world Germany had a forgettable second quarter, but analysts say they see light at the end of the tunnel. Consumer spending ticked higher, which could be the key to Germany’s economy moving forward. “The German economy contracted by a record 9.7% in the second quarter as consumer spending, company investments and exports all collapsed at the height of the COVID-19 pandemic,” Germany’s statistics office ‘Destatis’ reported. “The only bright spot was state consumption, which rose by 1.5% on the quarter due to the government’s coronavirus rescue programs,” the office said.
The world’s Chief Financial Officers now have a more positive economic outlook for China than they do for the United States, CNBC’s Global CFO Council Survey reported this week. This was the first time in the survey’s history that corporate executives were more upbeat on China than the United States. In the latest survey, CFOs gave an average outlook of “Stable” for China’s GDP, while seeing the U.S. economy as “Modestly Declining.” The outlook echoes reports that China’s economy is rebounding as life there starts to look more and more like it did before the pandemic. In July, China said its economy grew 3.2% in the second quarter; by comparison, the U.S. economy decreased by 9.5% in the same quarter.
Japan’s Prime Minister Shinzo Abe announced plans to cut short his stint as Japan’s Prime Minister, citing ill health. Abe took office in 2012 promising to reinvigorate the world’s third largest economy through massive monetary stimulus and increased government spending and economic reforms. The program has delivered mixed results. Falling prices were vanquished, but inflation has fallen far short of the 2% target set by the Bank of Japan. Analysts expect the prime minister to be replaced by another member of his party, and there’s little prospect of a shakeup at the Bank of Japan.
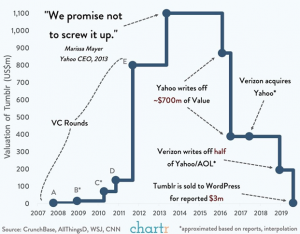
Finally: Onetime social media star Tumblr, which reached a peak valuation of over $1.1 billion, was sold to its long-time competitor WordPress for a paltry $3 million in 2019. The site was launched in 2007 by (then) 20-year old David Karp, with the intent of offering users an easier “less-techy” blogging experience. The site quickly picked up steam as popular bloggers, musicians, writers, and social-media influencers moved their content over to Tumblr. The popularity paid off. In 2013, Yahoo bought Tumblr for $1.1 billion, with Yahoo CEO Marissa Mayer promising “not to screw it up”. However, in the following years Tumblr struggled to compete with rising social media giants like Facebook, Twitter, and Instagram. The final nail in Tumblr’s coffin came when it banned porn-related material, which turned out to be a primary attraction for the majority of its remaining users. Traffic plummeted, monthly views dropped by hundreds of millions, and its fate was sealed. (Chart from chartr.co)
(Sources: All index- and returns-data from Yahoo Finance; news from Reuters, Barron’s, Wall St. Journal, Bloomberg.com, ft.com, guggenheimpartners.com, zerohedge.com, ritholtz.com, markit.com, financialpost.com, Eurostat, Statistics Canada, Yahoo! Finance, stocksandnews.com, marketwatch.com, wantchinatimes.com, BBC, 361capital.com, pensionpartners.com, cnbc.com, FactSet.) Securities offered through Registered Representatives of Cambridge Investment Research Inc., a broker-dealer, member FINRA/SIPC. Advisory Services offered through Cambridge Investment Research Advisors, a Registered Investment Adviser. Strategic Investment Partners and Cambridge are not affiliated. Indices mentioned are unmanaged and cannot be invested into directly. Past performance is no guarantee of future results.