
9-30-19 Weekly Market Update
The Very Big Picture:
The long-term valuation of the market is commonly measured by the Cyclically Adjusted Price to Earnings ratio, or “CAPE”, which smooths out shorter-term earnings swings in order to get a longer-term assessment of market valuation. A CAPE level of 30 is considered to be the upper end of the normal range, and the level at which further PE-ratio expansion comes to a halt (meaning that increases in market prices only occur in a general response to earnings increases, instead of rising “just because”). The market is currently at that level.
Of course, a “mania” could come along and drive prices higher – much higher, even – and for some years to come. Manias occur when valuation no longer seems to matter, and caution is thrown completely to the wind as buyers rush in to buy first and ask questions later. Two manias in the last century – the 1920’s “Roaring Twenties” and the 1990’s “Tech Bubble” – show that the sky is the limit when common sense is overcome by a blind desire to buy. But, of course, the piper must be paid and the following decade or two are spent in Secular Bear Markets, giving most or all of the mania gains back.
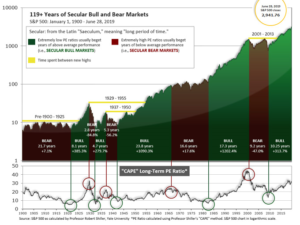
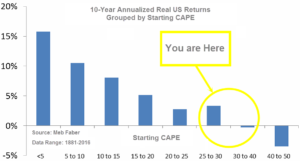
See Fig. 1 for the 100-year view of Secular Bulls and Bears. The CAPE is now at 29.69, down from the prior week’s 29.99, above the level reached at the pre-crash high in October, 2007. Since 1881, the average annual return for all ten year periods that began with a CAPE around this level have been in the 0% – 3%/yr. range. (see Fig. 2).
In the Big Picture:
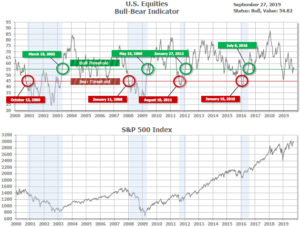
The “big picture” is the months-to-years timeframe – the timeframe in which Cyclical Bulls and Bears operate. The U.S. Bull-Bear Indicator (see Fig. 3) is in Cyclical Bull territory at 54.82, up from the prior week’s 56.72.
In the Intermediate and Shorter-term Picture:
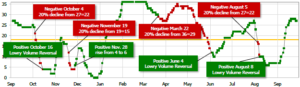
The Shorter-term (weeks to months) Indicator (see Fig. 4) is positive. The indicator ended the week at 27, down from the prior week’s 28. Separately, the Intermediate-term Quarterly Trend Indicator – based on domestic and international stock trend status at the start of each quarter – was positive entering July, indicating positive prospects for equities in the third quarter of 2019.
Timeframe summary:
In the Secular (years to decades) timeframe (Figs. 1 & 2), the long-term valuation of the market is historically too high to sustain rip-roaring multi-year returns. The Bull-Bear Indicator (months to years) remains positive (Fig. 3), indicating a potential uptrend in the longer timeframe. In the intermediate timeframe, the Quarterly Trend Indicator (months to quarters) is positive for Q3, and the shorter (weeks to months) timeframe (Fig. 4) is positive. Therefore, with three indicators positive and none negative, the U.S. equity markets are rated as Positive.
In the markets:
U.S. Markets: U.S. equities recorded losses for the week as concerns over trade and political uncertainty re‑emerged. For the second week, small-cap indexes underperformed large-caps and within the S&P 500 the typically defensive utilities sector outperformed. The Dow Jones Industrial Average retreated -0.4% to close at 26,820. The technology-heavy NASDAQ Composite fell -2.2%, back below the 8,000-level to 7,939. The large cap S&P 500 fell -1.0%, the mid cap S&P 400 gave up -1.1%, and the small cap Russell 2000 brought up the rear with a ‑2.5% loss.
International Markets: Canada’s TSX retraced almost all of last week’s gain by falling -1.2%, while the United Kingdom’s FTSE gained 1.1%. On Europe’s mainland, France’s CAC 40 declined -0.9%, Germany’s DAX fell -0.7%, and Italy’s Milan FTSE ended down -0.5%. In Asia, China’s Shanghai Composite retreated -2.5% and Japan’s Nikkei declined -0.9%. As grouped by Morgan Stanley Capital International, emerging markets declined -2.3% while developed markets ended down -0.9%.
Commodities: Precious metals didn’t get the usual benefit from the weakness in the equities markets. Instead, Gold gave up -0.6% to close at $1506.40 an ounce and Silver declined -1.1% to $17.65. Oil retraced all of last week’s gain and then some by falling -3.8% to $55.91 per barrel for West Texas Intermediate crude. The industrial metal copper, seen by some analysts as a barometer of global economic health due to its wide variety of uses, ended the week down -0.4%.
U.S. Economic News: The number of Americans seeking first-time unemployment benefits rose slightly last week, predominantly due to a UAW strike at many General Motors plants. The Labor Department reported initial jobless claims increased by 3,000 to 213,000 in the week ended September 21. Economists had expected new claims would total 211,000. Overall, however, new claims nationwide remained near a 50-year low. In the report, applications for benefits in Michigan more than doubled to 7,724 from the prior week, accounting for more than all of the weekly national gain.
The increase in the price of homes slowed to a crawl in July, according to the latest data from S&P/Case‑Shiller. The S&P CoreLogic Case-Shiller 20-city home price index held steady for the month of July, but on an annual basis, the index increased by just 2%. This represents the slowest rate of home-price appreciation since 2012. Furthermore, between June and July, home prices rose in only 14 of the 20 large cities that the Case-Shiller index tracks (and most of those increases were relatively small). Phoenix and Las Vegas continued to experience the highest rate of home-price growth, while Seattle remained the only city where home prices have actually declined over the past year. Nationally (above and beyond the 20 cities in the index), Case-Shiller reported that home prices were up 3.2% in July from the same time last year. That is slightly higher than the 3.1% increase posted in June.
The number of sales of homes in which a contract has been signed, but not yet closed, rose last month, led by gains in the West. The National Association of Realtors (NAR) reported its index of pending home sales increased 1.6% last month. The reading was a welcome rebound from July’s decline. Compared with the same time last year, contract signings were up 2.5%. Notably, this is only the third month this year in which contract signings have risen and pending home sales increased across all regions. The highest gain occurred in the West, where the pending home sales index rose 3.1% from July. Contract signings also increased 0.7% in the Northeast, 0.6% in the Midwest and 1.4% in the South. Lawrence Yun, chief economist for the NAR, said in the report “The notable sales slump in the West region over recent years appears to be over. Rising demand will reaccelerate home price appreciation in the absence of more supply.”
Orders for goods expected to last at least 3 years, so-called “durable goods”, rose slightly last month, but the increase was largely military-related. Stripping out Pentagon-related orders, the report was rather soft, adding to a picture of a slowing U.S. economy. The Commerce Department reported orders for durable goods increased 0.2% last month. Economists had forecast a decline of -0.7%. Yet if military orders are set aside, bookings were down -0.6%. In the report, orders surged 15% for defense capital goods, which includes things like aircraft, ships, tanks, and weapons systems. However, demand waned for new cars and trucks, computers, and appliances. “Core” orders, which strip out the volatile military and aircraft categories, declined -0.2% in August. These orders have fallen slightly over the past year, a decline that began with the trade dispute with China. BMO Senior Economist Sal Guatieri stated, “Trade protectionism continues to gum up U.S. manufacturing largely by undermining business investment.”
Market research firm IHS Markit stated the U.S. economy stabilized this month, according to two of its surveys. Following an episode of trade-related weakness toward the end of summer, the U.S. economy returned to slight growth, according to IHS Markit. Their flash manufacturing index rose to a 5-month high of 51 this month, up from 50.3 in the prior month, while its flash services index edged up 0.2 point to 50.9. However, while trade tensions have eased a bit, business executives are still on edge. Both IHS indexes remain near multi-year lows and sit just above the cutoff line that separates expansion from contraction. Most notably, employment levels in the services side of the economy declined for the first time in almost 10 years. This is particularly significant as more than 80% of American workers are employed in service-oriented companies such as retail, finance, health care, and education.
Confidence among American consumers fell to a 3-month low as trade tensions continued to escalate between the U.S. and China. The Conference Board reported its Consumer Confidence index dropped 9.1 points to 125.1 in September. Economists had expected a reading of 131.1. The decline puts the index at its lowest level since June and well off the post-recession peak of 137.9 set almost a year ago. In the details, the index that measures how consumers feel about the present fell sharply, as did the survey that measures expectations over the next 6 months. The so-called expectations index dropped to 95.8 from 106.4, the lowest reading since January. Consumer confidence is especially important as the U.S. economy is dependent on robust household spending to keep the economy growing. Jim Baird, Chief Investment Officer at Plante Moran Financial Advisors stated, “With business investment and trade both weighing on the economy, the importance of consumer spending at this juncture can’t be overstated.”
Consumers cut back on their spending in August and boosted their savings, but analysts believe the spending pause will be short-lived as incomes rise. The Commerce Department reported consumer spending rose 0.1% last month—its smallest increase in six months. Economists had expected an increase of 0.3%. Incomes rose for the fifth time in six months, up 0.4%, but most of it ended up in savings. The savings rate rose 0.3% to a healthy 8.1%. In addition, the report noted the Federal Reserve’s preferred measure of inflation – the Personal Consumption Expenditures (PCE) Index – remained flat with the core rate (which excludes food and energy) up just 0.1%. The increase in the PCE price gauge over the past 12 months was unchanged at 1.4%, well below the Fed’s 2% target.
The Commerce Department confirmed the U.S. economy grew more slowly in the second quarter, according to updated figures. The official score card for the U.S. economy, Gross Domestic Product (GDP), grew at a 2% annual pace from April through June. The reading remained unchanged from its previous estimate. Analysts expect the slow growth to persist through the end of the year largely due to the festering trade dispute with China. In the details, consumer spending was very strong in the spring, rising 4.6%. Consumer spending accounts for almost 70% of all U.S. economic activity. However, business investment declined a steeper 1.4% versus the 1.1% originally reported. Most other figures in the GDP report were little changed. GDP is revised twice after the initial release to take into account new or more accurate information.
International Economic News: The Bank of Canada stated it will be largely silent during the federal election campaign to avoid making any possible impact—or the appearance of any impact—on the political contest. Nicholas Galletti, a spokesman for the Bank of Canada wrote in an email, “As a neutral and politically independent organization, we aim to ensure our messages are not misinterpreted or misused during a period of heightened political sensitivity.” While silence during election periods isn’t new, it is more pronounced this time given the very public dispute between U.S. President Donald Trump and Federal Reserve Chairman Jerome Powell. The Canadian campaign is coming at a time of global trade conflicts and central banks around the world signaling or taking policy actions, including cutting interest rates. Canada’s economy has been resilient so far and the Bank of Canada has held steady on interest rates.
Across the Atlantic, sentiment among consumers in the United Kingdom fell to a six-year low due to increased worries about job security and the impact of trade tensions and political uncertainty on household finances. Market research firm YouGov reported its monthly consumer sentiment indicator dropped to 103.4 this month, down from 104.0 in August. The reading was its lowest since May of 2013. Kay Neufeld, head of macroeconomics at economic consultancy firm Cebr stated, “It is clear now that the UK has shifted into a slower growth mode due to a combination of ongoing domestic political uncertainty and global economic headwinds.” Britain’s economy unexpectedly contracted in the three months to June and the Bank of England and other economists predict only modest growth in the three months to September. Britain remains at risk of a disruptive “no-deal” Brexit on Oct. 31.
On Europe’s mainland, French business activity ground to a halt according to a surprising survey result from IHS Markit. According to figures released by Markit, France’s Purchasing Managers Index (PMI) registered its lowest reading in four months. The PMI dropped from 52.9 in August to 51.3 in September. The reading leaves the country on the brink of contraction in business activity. Weakness in the manufacturing sector was responsible for most of the decline in overall business activity. Services firms performed slightly better but still showed signs of a slowdown, once again dropping below the average.
A slump in manufacturing activity continues to worsen as Germany’s economy is suffering its steepest manufacturing downturn in almost seven years. Factory activity contracted at its fastest pace in a decade this month and growth in services activity softened, according to IHS Markit. In addition, there were other signs that Germany’s labor market is taking a hit. Global trade tensions, a challenging auto industry, and a looming Brexit all threaten to push Germany into recession. According to analysts at Markit, the economy may struggle to record any expansion at all for the rest of the year. In a sign that the export-driven industrial slump is spreading into the rest of the economy, Markit said jobs growth is stalling after almost six years of uninterrupted growth. Summing it up simply, Markit economist Phil Smith stated, “The manufacturing numbers are simply awful.”
China’s Foreign Minister hit back at U.S. President Donald Trump’s trade policies at the United Nations, warning that protectionism could plunge the world into a recession. Foreign Minister Wang Yi stated that “tariffs and provocations of trade disputes” are upsetting the global industrial and supply chain and risk undermining the “global economic and trade order”. “China will not ever be cowered by threats, or subdued by pressure”, Wang said. “Erecting walls will not resolve global challenges, and blaming others for one’s own problems does not work.” Wang’s speech came as Trump administration officials discussed ways to limit U.S. investors’ portfolio flows into China—a move that would have major repercussions for billions of dollars in investments.
Japan’s Prime Minister Shinzo Abe reached a trade deal with the U.S. covering agriculture, machine tools, and digital products. Most importantly, Japan’s automotive sector appears to have evaded the punishing 25% tariff U.S. President Donald Trump had threatened. The accord frees up Prime Minister Abe to focus on shoring up his own weak economy and American negotiators to focus their attention on China.
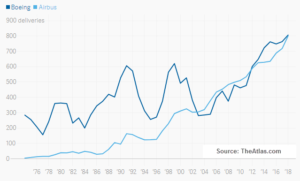
Finally: Gazing at the tarmac of any U.S. airport, a casual observer can be forgiven if he or she concludes that Boeing is hugely dominant in the commercial airliner business. But that would be wrong. Airbus has achieved parity with Boeing in annual deliveries, and is poised to overtake Boeing by a substantial margin this year, due in no small part to Boeing’s ongoing issues with the 737 Max jetliner. Through July, Boeing delivered 258 airliners this year, while Airbus delivered 458. The chart below, from TheAtlas.com, shows how neck-and-neck the race has been in recent years.
(Sources: all index return data from Yahoo Finance; Reuters, Barron’s, Wall St Journal, Bloomberg.com, ft.com, guggenheimpartners.com, zerohedge.com, ritholtz.com, markit.com, financialpost.com, Eurostat, Statistics Canada, Yahoo! Finance, stocksandnews.com, marketwatch.com, wantchinatimes.com, BBC, 361capital.com, pensionpartners.com, cnbc.com, FactSet) Securities offered through Registered Representatives of Cambridge Investment Research Inc., a broker-dealer, member FINRA/SIPC. Advisory Services offered through Cambridge Investment Research Advisors, a Registered Investment Adviser. Strategic Investment Partners and Cambridge are not affiliated.
Indices mentioned are unmanaged and cannot be invested into directly. Past performance is no guarantee of future results. All Investing involves risk. Depending on the types of investments, there may be varying degrees of risk. Investors should be prepared to bear loss, including total loss of principal.