
9-23-19 Weekly Market Update
The Very Big Picture:
The long-term valuation of the market is commonly measured by the Cyclically Adjusted Price to Earnings ratio, or “CAPE”, which smooths out shorter-term earnings swings in order to get a longer-term assessment of market valuation. A CAPE level of 30 is considered to be the upper end of the normal range, and the level at which further PE-ratio expansion comes to a halt (meaning that increases in market prices only occur in a general response to earnings increases, instead of rising “just because”). The market is currently at that level.
Of course, a “mania” could come along and drive prices higher – much higher, even – and for some years to come. Manias occur when valuation no longer seems to matter, and caution is thrown completely to the wind as buyers rush in to buy first and ask questions later. Two manias in the last century – the 1920’s “Roaring Twenties” and the 1990’s “Tech Bubble” – show that the sky is the limit when common sense is overcome by a blind desire to buy. But, of course, the piper must be paid and the following decade or two are spent in Secular Bear Markets, giving most or all of the mania gains back.
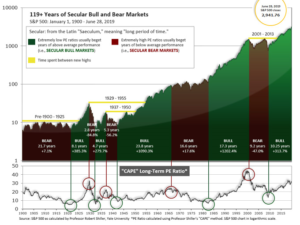
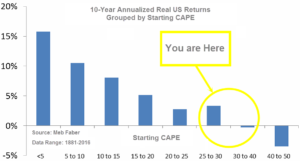
See Fig. 1 for the 100-year view of Secular Bulls and Bears. The CAPE is now at 29.99, down from the prior week’s 30.14, above the level reached at the pre-crash high in October, 2007. Since 1881, the average annual return for all ten year periods that began with a CAPE around this level have been in the 0% – 3%/yr. range. (see Fig. 2).
In the big picture:
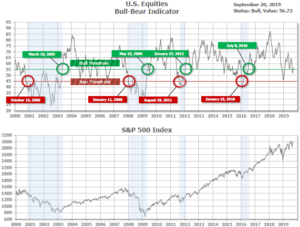
The “big picture” is the months-to-years timeframe – the timeframe in which Cyclical Bulls and Bears operate. The U.S. Bull-Bear Indicator (see Fig. 3) is in Cyclical Bull territory at 56.72, up from the prior week’s 56.19.
In the Intermediate and Shorter-term Picture:
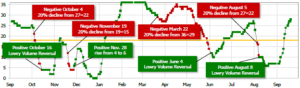
The Shorter-term (weeks to months) Indicator (see Fig. 4) is positive. The indicator ended the week at 28, up from the prior week’s 24. Separately, the Intermediate-term Quarterly Trend Indicator – based on domestic and international stock trend status at the start of each quarter – was positive entering July, indicating positive prospects for equities in the third quarter of 2019.
Timeframe summary:
In the Secular (years to decades) timeframe (Figs. 1 & 2), the long-term valuation of the market is historically too high to sustain rip-roaring multi-year returns. The Bull-Bear Indicator (months to years) remains positive (Fig. 3), indicating a potential uptrend in the longer timeframe. In the intermediate timeframe, the Quarterly Trend Indicator (months to quarters) is positive for Q3, and the shorter (weeks to months) timeframe (Fig. 4) is positive. Therefore, with three indicators positive and none negative, the U.S. equity markets are rated as Positive.
In the Markets:
U.S. Markets: Following a spike in the price of oil due to an attack on a Saudi Arabian oil facility, equities finished the week modestly lower. The Dow Jones Industrial Average gave up 284 points, ending the week at 26,935—a decline of -1.1%. The technology-heavy NASDAQ Composite retreated -0.7% to 8,117. By market cap the large cap S&P 500 fell -0.5%, while the S&P 400 midcap index and small cap Russell 2000 finished down -0.9% and ‑1.2%, respectively. The dramatic outperformance by small caps last week did not persist into this week.
International Markets: International markets were mixed for the week. Canada’s TSX rose for a fourth consecutive week, adding 1.3%, while the United Kingdom’s FTSE declined -0.3%. On Europe’s mainland, France’s CAC 40 added 0.6% while Germany’s DAX finished essentially flat. In Asia, China’s Shanghai Composite declined -0.8% and Japan’s Nikkei finished up 0.4%–its third straight gain. As grouped by Morgan Stanley Capital International, developed markets finished down -0.6%, while emerging markets fell -1.5%.
Commodities: Precious metals rose for the first week in four, reflecting the weakness in the equities markets. Gold rose $15.60 an ounce ending the week at $1515.10—a gain of 1%. Silver added 1.6% and closed at $17.85 an ounce. Oil rallied following the attack on Saudi Arabia’s oil facility, rising 5.9% to $58.09 per barrel. The industrial metal copper, sometimes called “Dr. Copper” due to its value as a barometer of world economic health, finished the week down -3.5%.
U.S. Economic News: The number of Americans applying for new unemployment benefits inched higher last week, the Labor Department reported. Initial jobless claims rose by 2,000 to 208,000. Economists had estimated claims would come in at 215,000. The monthly moving average of claims, smoothed to iron out the weekly volatility, fell by a smaller 750 to 212,250. Claims remain far below the key 300,000 threshold that economists use to denote a “balanced” jobs market. Jim O’Sullivan, chief U.S. economist at High Frequency Economics wrote in a note to clients, “Claims remain low, consistent with a still-solid trend in employment growth. While net employment growth depends on gross hiring as well as the pace of layoffs, and the trend in payrolls gains appears to have moderated a bit – due to reduced hiring rather than increased firing – major weakening in employment growth is invariably associated with an uptrend in claims.”
The Commerce Department said construction of new housing surged 12% last month to its fastest pace in more than a year. Housing starts increased at an annual rate of 1.36 million in August, up from a revised 1.22 million in July. Economists had expected a 1.26 million rate for starts. The reading was the fastest pace for starts since 2007. In addition, in a positive sign for future building activity, permits to build additional homes rose 8% to a seasonally-adjusted annual pace of 1.42 million. The details of the report revealed that the jump was driven predominantly by the construction of multifamily properties such as apartments and condominiums. The rate of construction of buildings with five or more units jumped 30% to an annual rate of 424,000. Single-family home starts were up a more modest 4%. Nevertheless, August was the strongest month for single-family starts since January.
Confidence among the nation’s home builders rose slightly, despite overall concerns about the nation’s economy. The National Association of Home Builders (NAHB) reported its monthly confidence index increased one point to 68 this month—matching its highest reading in a year. Readings over 50 signify that confidence is improving, while figures below show sentiment is deteriorating. In the details of the NAHB report, the gauge of current single-family home sales increased two points to 75, also its highest reading in a year, while the sub-index that tracks expectations for future sales dropped one point to 70. The gauge for buyer traffic remained unchanged at 50. Regionally, home‑builder sentiment improved markedly in the Northeast, South and West and remained even in the Midwest.
The Conference Board reported its Leading Economic Index (LEI) remained unchanged in August at 112.1. The reading follows a 0.4% increase in July and no change in June. Ataman Ozyildirim, Senior Director of Economic Research at The Conference Board stated, “The US LEI remained unchanged in August, following a large increase in July. Housing permits and the Leading Credit Index offset the weakness in the index from the manufacturing sector and the interest rate spread. The recent trends in the LEI are consistent with a slow but still expanding economy, which has been primarily driven by strong consumer spending and robust job growth.”
Manufacturing activity in the New York region weakened significantly this month, but remained above zero. The New York Federal Reserve reported its Empire State Manufacturing index fell 2.8 points to 2.0 in September, missing expectations for an unchanged reading. In the details, the new-orders index fell 3.2 points to 3.5, while the shipments index fell 3.5 points to 5.8—its lowest level in almost three years. In addition, unfilled orders remained negative for a fourth consecutive month. The index that measures how manufacturers feel about the future plunged 12 points to 13.7. The one bright spot in the report was employment, which rebounded out of negative territory. Some analysts remain optimistic that the weakness in manufacturing may have run its course. Thomas Simons, senior economist at Jefferies believes so: “The sector has suffered from the uncertainty caused by the trade war, and there’s been a significant loss in momentum in business investment, but the pullback has now played out to the point where we expect to see data that suggests the sector is drifting sideways.”
In the city of Brotherly Love, manufacturing activity weakened but remained in positive territory according to the Philadelphia Fed. The Philadelphia Federal Reserve’s manufacturing index fell -4.8 points to 12.0 in September. Economists had expected a reading of 10.0. In the details, the index for general activity and new orders fell, while the indexes for shipments and employments increased. The survey’s future general activity index moderated but continues to suggest growth over the next six months. In a note to clients, Joshua Shapiro, Chief U.S. Economist at Maria Fiorini Ramirez wrote, “The fact that the new orders measure has now posted six consecutive good results after weakening significantly in February and March is an encouraging sign, and suggests that the factory sector, while suffering from an inventory correction, weak demand abroad and the effects of tariffs, has not fallen off a cliff.”
As was widely expected by market participants, the Federal Reserve lowered its key interest rate target range by a quarter point to 1.75-2%. Furthermore, in its statement the Fed expressed an openness to even more easing. This week’s cut was the second in two months. Three of the seven members dissented from the quarter-point cut. Two voted against the move because they felt rates should be held steady, and one because he wanted a more aggressive half-point cut. Seven Fed officials said they believed there would be one more rate cut this year. In explaining the decision Powell told reporters at a briefing, “Our business contacts around the country have been telling us that uncertainty is weighing on U.S. investment and exports.” Powell said the Fed sees a favorable economic outlook, but said there were risks. “If the economy does turn down, then a more extensive sequence of rate cuts could be appropriate,” he said.
International Economic News: A poll of 1,517 Canadians showed that the economy and their own personal financial situation weighed heavily on their minds and in turn, analysts say, affects the way they’ll vote. The data explained why Canada’s main political parties are making pitches on issues like the economy and the ability of everyday voters to get ahead. When asked to rate how their own economic situation is compared to four years ago when the last election was held, more Canadians say they are worse off than better off, according to the DART & Maru/Blue Voice Canada Poll. Despite the feelings of voters, the Canadian economy has been performing relatively well for the country as a whole – but that doesn’t mean voters buy it. When asked if they believe economists, politicians and others who say the Canadian economy is “in good shape and job growth is strong,” just 44% said yes while 56% said no.
Across the Atlantic, the Organization for Economic Cooperation and Development (OECD) speculated a “no-deal” Brexit scenario would cut almost 3% from the United Kingdom’s economic growth over the next three years, compared to just 0.6% for the rest of the European Union. The OECD analysis estimates that losing unrestricted access to EU markets will most likely plunge the United Kingdom into recession next year. The loss of trade, investment and technical knowledge plus a further fall in the pound will prolong Britain’s reduced growth rate until at least 2022, the report further states. Laurence Boone, the OECD’s chief economist, said an agreement to smooth Britain’s exit was important to protect businesses and the economy. “The best thing is to avoid a no-deal Brexit and to stay as closely aligned to the EU as possible,” she said.
On Europe’s mainland, France’s Finance Minister Bruno Le Maire asserted at a joint news conference in Paris this week that Germany should act sooner rather than later to revive its flagging economy. French policymakers are growing anxious as Germany, Europe’s largest economy, appeared indecisive over how to pull itself back from the brink of recession. In addition, they want Berlin to do more with its budget surplus. Le Maire said the two countries had agreed on a strategy to respond to the global economic slowdown and trade tensions, which are hitting Germany’s export-driven economy particularly hard. However, Le Maire said that while there was agreement on the approach there remained an open debate on the timeframe for action.
Germany’s ZEW Indicator of Economic Sentiment showed that expectations for the German economy rebounded in September as concerns over the impact of the U.S.-China trade war and Brexit eased. The ZEW survey of financial market experts found that sentiment improved this month from a minus 44.1 to minus 22.5. However, the results of the survey were still far below their long-term average. It also found that sentiment about the current economic situation in Germany had worsened by 6.4 points to minus 19.9 — its lowest level of the last nine years. The German economy shrank by 0.1% in the second quarter and is widely forecast to have another downturn in the third quarter. Achim Wambach, ZEW president stated, “The outlook remains negative. However, the rather strong fears that financial experts had in the previous month regarding a further intensification of the trade conflict between the USA and China did not come true. And there is still hope that a no-deal Brexit can be avoided.”
China’s economy faces a “triple threat”, according to one economist. Nomura Research Institute chief economist Richard Koo released a note detailing that a “triple threat of growth attenuating factors” could cripple China’s economy. The report states the three primary threats to Chinese growth are a projected decline in the nation’s population starting in 2032, a middle-income trap in which more citizens are making higher wages thus jeopardizing the country’s low-cost labor market, and an escalation of the U.S.-China trade war. These factors could eliminate China’s manufacturing advantage and send multinational corporations to other countries for their cheap labor, Koo wrote.
Japan’s government kept its view that the economy is recovering at a moderate pace this month, but flagged persistent weakness in the country’s export sector, according to the monthly report released by Japan’s Cabinet Office this week. The government left its assessment of most of the individual components of economic growth unchanged, offering a generally positive view of domestic demand ahead of a sales tax hike scheduled for October. However, the housing sector was downgraded for the first time in more than a year due to a decline in new home construction. The government’s assessment this week aligns with data from past months that shows strength in domestic demand such as private consumption offsetting external headwinds.
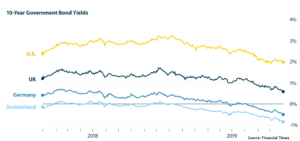
Finally: Following this week’s interest rate cut, U.S. President Donald Trump blasted Federal Reserve Chairman Jerome Powell and his fellow Federal Reserve officials as having “No guts, no sense, no vision!” and further that Powell was a “terrible communicator”. OK, we get the idea that Trump did not agree with Powell et al, but why? Trump had been arguing for a larger rate cut, complaining that current interest levels in the U.S. put the country at an economic disadvantage relative to countries with lower rates. Since it costs more to borrow in the U.S. relative to other countries, the higher interest rate impedes business and weighs on U.S. economic activity. Regardless of one’s opinion of Trump’s social skills and manners, he does have a point. The chart below, for example, shows the 10-year government bond yields for the U.S. and some major European competitors. Germany and Switzerland already have negative interest rates, the UK appears to be headed that way, while the U.S., at 2%, seems way out of step – and at a disadvantage (at least according to the President).
(Sources: all index return data from Yahoo Finance; Reuters, Barron’s, Wall St Journal, Bloomberg.com, ft.com, guggenheimpartners.com, zerohedge.com, ritholtz.com, markit.com, financialpost.com, Eurostat, Statistics Canada, Yahoo! Finance, stocksandnews.com, marketwatch.com, wantchinatimes.com, BBC, 361capital.com, pensionpartners.com, cnbc.com, FactSet) Securities offered through Registered Representatives of Cambridge Investment Research Inc., a broker-dealer, member FINRA/SIPC. Advisory Services offered through Cambridge Investment Research Advisors, a Registered Investment Adviser. Strategic Investment Partners and Cambridge are not affiliated.
Indices mentioned are unmanaged and cannot be invested into directly. Past performance is no guarantee of future results. All Investing involves risk. Depending on the types of investments, there may be varying degrees of risk. Investors should be prepared to bear loss, including total loss of principal.