
10-7-19 Weekly Market Update
The Very Big Picture:
The long-term valuation of the market is commonly measured by the Cyclically Adjusted Price to Earnings ratio, or “CAPE”, which smooths out shorter-term earnings swings in order to get a longer-term assessment of market valuation. A CAPE level of 30 is considered to be the upper end of the normal range, and the level at which further PE-ratio expansion comes to a halt (meaning that increases in market prices only occur in a general response to earnings increases, instead of rising “just because”). The market is currently at that level.
Of course, a “mania” could come along and drive prices higher – much higher, even – and for some years to come. Manias occur when valuation no longer seems to matter, and caution is thrown completely to the wind as buyers rush in to buy first and ask questions later. Two manias in the last century – the 1920’s “Roaring Twenties” and the 1990’s “Tech Bubble” – show that the sky is the limit when common sense is overcome by a blind desire to buy. But, of course, the piper must be paid and the following decade or two are spent in Secular Bear Markets, giving most or all of the mania gains back.
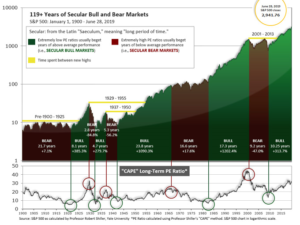
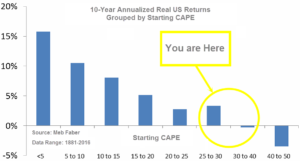
See Fig. 1 for the 100-year view of Secular Bulls and Bears. The CAPE is now at 29.59, down from the prior week’s 29.69, above the level reached at the pre-crash high in October, 2007. Since 1881, the average annual return for all ten year periods that began with a CAPE around this level have been in the 0% – 3%/yr. range. (see Fig. 2).
In the Big Picture:
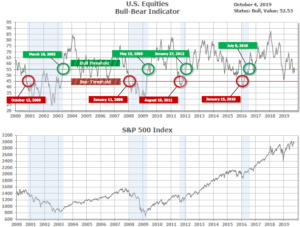
The “big picture” is the months-to-years timeframe – the timeframe in which Cyclical Bulls and Bears operate. The U.S. Bull-Bear Indicator (see Fig. 3) is in Cyclical Bull territory at 52.53, down from the prior week’s 54.82.
In the Intermediate and Shorter-term Picture:
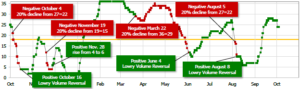
The Shorter-term (weeks to months) Indicator (see Fig. 4) is positive. The indicator ended the week at 24, down from the prior week’s 27. Separately, the Intermediate-term Quarterly Trend Indicator – based on domestic and international stock trend status at the start of each quarter – was positive entering October, indicating positive prospects for equities in the fourth quarter of 2019.
Timeframe Summary:
In the Secular (years to decades) timeframe (Figs. 1 & 2), the long-term valuation of the market is historically too high to sustain rip-roaring multi-year returns. The Bull-Bear Indicator (months to years) remains positive (Fig. 3), indicating a potential uptrend in the longer timeframe. In the intermediate timeframe, the Quarterly Trend Indicator (months to quarters) is positive for Q4, and the shorter (weeks to months) timeframe (Fig. 4) is positive. Therefore, with three indicators positive and none negative, the U.S. equity markets are rated as Positive.
In the Markets:
U.S. Markets: Most of the major U.S. indexes suffered their third consecutive week of losses as evidence accumulated of a global economic slowdown. Strength in Apple and other information technology shares supported the NASDAQ Composite, which ended modestly higher for the week and was the lone gainer. The Dow Jones Industrial Average retreated -0.9% ending the week at 26,573. The technology-heavy NASDAQ Composite managed a 0.5% gain for the week. Small caps continued to sell off with the Russell 2000 index falling a further ‑1.3%, while the S&P 400 midcap index and S&P 500 large cap index retreated -1% and -0.3%, respectively.
For the month of September, U.S. indexes were all positive, but the quarter was mixed with 3 of the “big 5” down for the quarter. Year to date, NASDAQ leads and Small Caps bring up the rear, but all are having a decent year.
| Index | September % | 3rd Qtr % | Year-to-Date % |
| NASDAQ | 0.5 | -0.1 | 20.6 |
| Dow 30 | 1.9 | 1.2 | 15.4 |
| Mid Cap | 2.9 | -0.5 | 16.4 |
| Small Cap | 1.9 | -2.8 | 13.0 |
| S&P 500 | 1.7 | 1.2 | 18.7 |
International Markets: Major developed international markets were a sea of red for the week. Canada’s TSX had its second consecutive week of losses giving up -1.5%, while the United Kingdom’s FTSE retraced all of last week’s gain and then some falling -3.7%. On Europe’s mainland, France’s CAC 40 retreated -2.7%, Germany’s DAX fell -3.0%, and Italy’s Milan FTSE gave up -2.5%. In Asia, China’s Shanghai Composite was closed for the week for its National Day holiday. Japan’s Nikkei ended down -2.1%. As grouped by Morgan Stanley Capital International emerging markets rebounded 0.8%, while developed markets ended down -1.2%.
For the month of September, major international indexes were all positive with Japan highest and China lowest, and most were also up for the quarter. Year to date, Italy and France are leading among those shown in the table while Japan is at the rear. What the table doesn’t show is the underperformance in a variety of emerging markets around the world in the third quarter, resulting in the Emerging Markets category being far behind Developed Markets year to date.
| Index | September % | 3rd Qtr % | Year-to-Date % |
| CAC 40 Index (France) | 3.6 | 2.5 | 20.0 |
| DAX (Germany) | 4.1 | 0.2 | 17.7 |
| FTSE 100 (UK) | 2.8 | -0.2 | 10.1 |
| FTSE MIB (Italy) | 3.7 | 4.1 | 20.6 |
| Nikkei 225 (Japan) | 5.1 | 2.3 | 8.7 |
| TSX (Canada) | 1.3 | 1.7 | 16.3 |
| Shanghai Exchange (China) | 0.7 | -2.5 | 16.5 |
| iShares MSCI Emerging Mkts ETF (EEM) | 1.7 | -4.8 | 5.4 |
| iShares MSCI Developed Mkts ETF (EFA) | 3.2 | -0.8 | 13.3 |
Commodities: Precious metals finished the week mixed. Gold rose 0.4%, ending the week at $1512.90 per ounce. Silver, however, gave up -0.2% closing at $17.62 per ounce. Oil fell back to its August lows, falling -5.5%, to $52.81 per barrel of West Texas Intermediate crude oil. The industrial metal copper, viewed by some analysts as a barometer of global economic health due to its variety of uses, finished the week down -1.4%.
For the month of September, the commodities shown in the table were mixed, but gold and silver nonetheless had a nice third quarter. Year to date, gold and silver lead the group, but copper has languished far behind, perhaps reflecting worldwide economic unease.
| September % | 3rd Qtr % | Year-to-Date % | |
| Gold (GLD) | -3.4 | 4.3 | 15.0 |
| Silver (SLV) | -7.2 | 11.1 | 9.6 |
| Oil (XLE) | 3.9 | -6.2 | 6.0 |
| Copper (CPER) | 0.8 | -4.9 | -1.9 |
U.S. Economic News: The number of people seeking first-time unemployment benefits rose to a one-month high last week, the Labor Department reported. Initial jobless claims rose by 4,000 to 219,000 last week, partially due to the three-week-old labor strike at General Motors that has idled tens of thousands of workers. Economists had forecast a reading of 218,000. Raw or actual claims — before seasonal adjustments — surged in Ohio and remained elevated in Michigan, two states with large auto industries. Some 250,000 workers at GM and some of its parts suppliers have been sidelined during the strike. The less-volatile monthly average of new claims remained unchanged at 212,500. The monthly number usually gives a more accurate read into labor-market conditions than the more volatile weekly number. Continuing claims, which counts the number of people already receiving benefits, declined by 5,000 to 1.65 million. That number remains near a cycle low.
The labor market continues to show resilience in the face of weakening global economic data. The Bureau of Labor Statistics reported the economy added 136,000 new jobs in September, raising hopes that the economy might avoid a recession. Hiring in education and health services led the way, followed by professional and business services. Retail trade suffered the worst pullback. Economists had forecast an increase of 150,000. The reading was the slowest pace of job growth in four months, but employment gains for August and July were revised up by a combined 45,000. To put the reading into perspective, the pace of job growth has slowed from 223,000 per month in 2018 to 158,000 over the last three months. In a separate survey, the U.S. unemployment rate dropped to just 3.5%–its lowest rate since December 1969. However, one concern in the report was worker pay. The annual rate of increase in compensation fell to 2.9% from 3.2%.
Manufacturing activity in the Windy City contracted for the third time in four months, according to research firm MNI Indicators. MNI reported their Chicago Purchasing Managers Index (PMI) business barometer dropped to 47.1 in September, down from 50.4 in August. Readings below 50 indicate worsening conditions. Economists had expected a reading of 50. The details of the report show widespread weakness. Production in the Chicago region hit a 10-year low, exaggerated by the UAW strike at GM. However, unrelated to the strike, the report also showed declines in orders and inventories. MNI notes that the eroding business conditions in the Chicago region mirror the nationwide trend in manufacturing. A stronger U.S. dollar, slowing global economy, and ongoing trade dispute between the U.S. and China have all curbed demand for U.S. manufactured goods.
Nationwide, manufacturers experienced their worst month since the 2007-2009 Great Recession according to the Institute for Supply Management (ISM). ISM reported its manufacturing index plunged deeper into contraction to 47.8 last in September, down from 49.1. The reading marks its lowest level since June of 2009. Economists had expected the index to rebound to 50.2. In the details of the report, production, employment, and inventories all declined. New orders did tick up, but remained in contraction at 47.3—its weakest level in a decade. Furthermore, only three of the eighteen U.S. manufacturing industries tracked by ISM reported growth, down from nine in the prior month. Chris Low, Senior Economist at FTN Financial wrote in a research note, “Manufacturing weakness is close to dangerous levels. Historically, readings under 46 are consistent with recession.”
The services sector, which makes up almost 80% of U.S. GDP, registered its weakest growth in September in more than three years, according to the Institute for Supply Management (ISM). ISM’s non-manufacturing index fell to 52.6 last month, down 3.8 points from August. The reading missed economists’ expectations of 55.3 by a wide margin. The index has fallen 8 points below its post-2008 recession peak of 60.8 reached just last fall. The decline has largely coincided with the intensifying trade dispute with China. In the details, business production and new orders grew more slowly, while employment levels remained essentially flat. The index for production slid to 55.2 from 61.5. The employment gauge dropped to a five-year low of 50.4 — barely above the cutoff point that separates net hiring from net layoffs. The ISM indexes are compiled from a survey of executives who order raw materials and other supplies for their companies, and tend to rise or fall in tandem with the health of the economy.
International Economic News: Canada’s economic growth remained flat in July as weakness in oil and gas extraction was offset by gains in service industries. Economists had expected growth of 0.1%. The flat reading came as manufacturing fell 0.7%. The mining, quarrying, and oil and gas extraction sectors pulled back 3.5%, the largest monthly decrease since May of 2016. Overall 12 of the 20 industrial sectors monitored expanded on the month, while eight declined. On the services side of the economy, Statistics Canada reported 0.3% growth, the fifth consecutive month of gains.
Across the Atlantic, the United Kingdom received further bad economic news before the its bid to leave the European Union. Research firm IHS Markit/CIPS reported it’s Purchasing Managers’ Index for the UK fell further into contraction to 43.3, from 45 in August. It was the second worst reading in more than a decade. Purchasing managers attributed the continued slowdown to Brexit uncertainty and the resulting hesitancy of customers to make large purchases prior to an agreement. Boris Johnson is sending what he says is the U.K.’s “final offer” for a Brexit deal to the European Union next week.
On Europe’s mainland, even as global economic weakness drags Europe into a deeper slowdown France is remaining remarkably resilient. French statistics agency INSEE reported business investment, tax cuts, and a robust labor market have maintained growth in France. Insee sees the French economy growing 1.3% this year. That’s more than twice the figure expected for Germany, where the country’s leading research institutes this week cut their forecasts. While INSEE’s outlook only runs to the end of the year, it highlights the characteristics of the French economy that provide some shelter from global trade turmoil – France is less exposed than Germany to global trade and it has a propensity to use deficit spending to support demand.
Germany’s leading economic research institutes sharply downgraded their forecasts for Europe’s economic powerhouse this week. Ifo Institute stated its joint economic forecast for 2019 was revised down from 0.8% GDP growth projected this spring, to just 0.5%. Ifo stated its reasons for the downgrade include falling global demand for capital goods, which has hit Germany’s export-reliant economy, along with political uncertainty and structural changes in the automotive industry. For 2020, the various economic research institutes have reduced their GDP growth forecasts to 1.1% from the 1.8% predicted in the spring. The joint forecast comprises research from German research institutes DIW, the Ifo Institute, IfW (Kiel Institute), IWH (Halle Institute for Economic Research and RWI Essen (Rheinisch-Westfälisches Institut).
The outlook for the global economy has “deteriorated significantly” due to the escalation in the U.S.-China trade war, according to Fitch Ratings’ Global Economic Outlook. The credit rating agency forecasts world growth will fall next year to its lowest rate since 2012. Brian Coulton, chief economist at Fitch stated, “There can be few precedents since the 1930s of global growth prospects being affected so significantly by trade policy disruptions.” China’s 2020 growth forecast has been revised down to 5.7% from 6.0%. Lower growth in China will prolong the slump in global trade and manufacturing, which will, in turn, continue to pressure Eurozone expansion, the report states.
Japanese Prime Minister Shinzo Abe said the government was ready to take “all possible steps” if risks to the economy intensified. Abe’s remarks came as the U.S.-China trade war continued to escalate and soft global demand has continued to weigh on Japanese manufacturers. Earlier this week, the Bank of Japan’s tankan survey showed business sentiment plummeting to a six-year low in the third quarter. Japan enacted its 2% sales tax increase to 10% from 8% this week, a move seen as critical to fixing the country’s financial situation. However, the increase may hurt the economy by dampening consumer sentiment. Bank of Japan Governor Haruhiko Kuroda has warned that the central bank must carefully watch how the tax increase could affect consumer sentiment, adding that it was ready to ease monetary policy further if risks intensify.
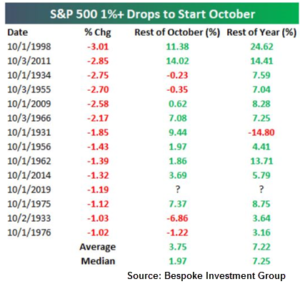
Finally, the month of October has experienced some of the worst market crashes in history. The Bank Panic of 1907, Black Tuesday, Black Thursday, Black Monday that occurred in 1929, and Black Monday in 1987 – the great crash of 1987 that saw the Dow plummet 22.6% in a single day – all occurred in the month of October. This year the market began the month with a decline of at least 1% in each of the major benchmarks, and the S&P 500 notched its worst daily loss since August 23rd. You might think that a lousy start to October portends an even lousier whole month of October. But it turns out that a lousy first day of October usually sets the stage for a decent October overall and even a decent fourth quarter. Bespoke Investment Group produced the table below that documents this phenomenon.
(Sources: all index return data from Yahoo Finance; Reuters, Barron’s, Wall St Journal, Bloomberg.com, ft.com, guggenheimpartners.com, zerohedge.com, ritholtz.com, markit.com, financialpost.com, Eurostat, Statistics Canada, Yahoo! Finance, stocksandnews.com, marketwatch.com, wantchinatimes.com, BBC, 361capital.com, pensionpartners.com, cnbc.com, FactSet) Securities offered through Registered Representatives of Cambridge Investment Research Inc., a broker-dealer, member FINRA/SIPC. Advisory Services offered through Cambridge Investment Research Advisors, a Registered Investment Adviser. Strategic Investment Partners and Cambridge are not affiliated.
Indices mentioned are unmanaged and cannot be invested into directly. Past performance is no guarantee of future results. All Investing involves risk. Depending on the types of investments, there may be varying degrees of risk. Investors should be prepared to bear loss, including total loss of principal.