9-28-20 Weekly Market Update
The Very Big Picture
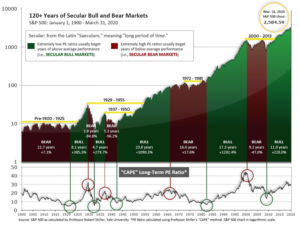
The long-term valuation of the market is commonly measured by the Cyclically Adjusted Price to Earnings ratio, or “CAPE”, which smooths-out shorter-term earnings swings in order to get a longer-term assessment of market valuation. A CAPE level of 30 is considered to be the upper end of the normal range, and the level at which further PE-ratio expansion comes to a halt (meaning that further increases in market prices only occur as a general response to earnings increases, instead of rising “just because”). The market was recently at that level.
Of course, a “mania” could come along and drive prices higher – much higher, even – and for some years to come. Manias occur when valuation no longer seems to matter, and caution is thrown completely to the wind – as buyers rush in to buy first, and ask questions later. Two manias in the last century – the “Roaring Twenties” of the 1920s, and the “Tech Bubble” of the late 1990s – show that the sky is the limit when common sense is overcome by a blind desire to buy. But, of course, the piper must be paid, and the following decade or two were spent in Secular Bear Markets, giving most or all of the mania-gains back.

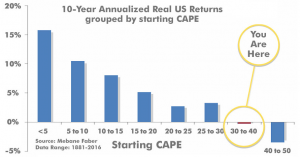
See Fig. 1 for the 100-year view of Secular Bulls and Bears. The CAPE is now at 30.29, up from the prior week’s 28.53. Since 1881, the average annual return for all ten-year periods that began with a CAPE in the 25-35 range have been slightly-positive to slightly-negative (see Fig. 2).

Note: We do not use CAPE as an official input into our methods. However, if history is any guide – and history is typically ‘some’ kind of guide – it’s always good to simply know where we are on the historic continuum, where that may lead, and what sort of expectations one may wish to hold in order to craft an investment strategy that works in any market ‘season’ … whether current one, or one that may be ‘coming soon’!
The Big Picture
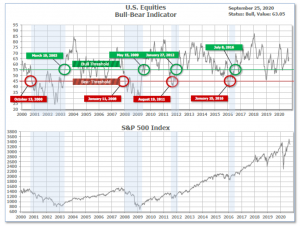
The ‘big picture’ is the (typically) years-long timeframe – the timeframe in which Cyclical Bulls and Bears operate. The U.S. Bull-Bear Indicator is in Cyclical Bull territory at 63.05 down from the prior week’s 66.52.

In the Quarterly- and Shorter-term Pictures
The Quarterly-Trend Indicator based on the combination of U.S. and International Equities trend-statuses at the start of each quarter – was Positive entering July, indicating positive prospects for equities in the third quarter of 2020.
Next, the short-term(weeks to months) Indicator for US Equities turned negative on September 3rd and ended the week at 7, down sharply from the prior week’s 18.

In the Markets:
U.S. Markets: The large-cap benchmark S&P 500 suffered a fourth week of declines, sending the index briefly into correction territory (defined as down 10% or more from its recent peak). The Dow Jones Industrial Average gave up 483 points to end the week at 27,174, a decline of -1.7%. The technology-heavy NASDAQ Composite went the other way, finishing the week up 1.1%. By market cap, the large cap S&P 500 gave up -0.6%, while the mid cap S&P 400 and small cap Russell 2000 declined -2.6% and -4.0%, respectively.
International Markets: Major international markets were a sea of red this week. Canada’s TSX fell -0.8%, while the UK’s FTSE 100 retreated -2.7%. France’s CAC 40 plunged -5.0% along with Germany’s DAX which fell -4.9%. In Asia, China’s Shanghai Composite ended down -3.6% while Japan’s Nikkei declined -0.7%. As grouped by Morgan Stanley Capital International, developed markets retreated -3.1% while emerging markets gave up -3.5%.
Commodities: Commodities continued to sell off, with precious metals leading the way. Gold fell -$95.80 to $1866.30 an ounce, a decline of -4.9%. Silver plunged a much larger -14.9% to $23.09 per ounce. Crude oil declined as well. West Texas Intermediate crude oil fell by -2.6% to $40.25 per barrel. The industrial metal copper, viewed by some analysts as a barometer of world economic health due to its wide variety of uses, ended the week down -4.7%.
U.S. Economic News: The Labor Department reported the number of Americans applying for first-time unemployment benefits rose by 4,000 to 870,000. Economists had estimated claims to decline to 850,000. The four-week moving average of initial claims, smoothed to iron-out the weekly volatility, fell 35,250 to 878,250 in the latest week. Continuing claims, which counts the number of people already receiving benefits, fell by 167,000 to 12.58 million. That is the lowest level of continued claims since mid-April. Overall, jobless claims have been drifting lower in recent weeks. Roughly half of the 22 million payroll jobs that were lost in March and April have been regained as Americans return to work.
Sales of existing homes jumped last month at the fastest pace in more than a decade. The National Association of Realtors reported total existing home sales rose 2.4% from July to a seasonally-adjusted annual rate of 6 million. It was the third consecutive month of increases and its fastest pace since December 2006. Compared with the same time last year, home sales were up 10.5%. By region, the Northeast experienced the biggest jump in sales, up 13.8%, while the West and South were only up 0.8%. Economists noted that wildfires in the West and stormy weather in the South hampered activity in those regions. As sales increased, so did prices. The median existing-home price was $310,600 in August, up 11.4% from a year ago. Tightening inventory contributed to the rise in prices. Unsold inventory sat at a 3-month supply in August, compared to the 6 months inventory that is generally considered to be a “balanced” housing market.
Overall economic activity across the nation fell in August according to the Chicago Federal Reserve. The Chicago Fed’s National Activity Index came in at 0.79 from a revised 2.54 the prior month. A zero value indicates the national economy is expanding at its historic trend rate of growth. The index’s three-month moving average, which tries to smooth out volatility, slipped to 3.05 from 4.23 in July. The Chicago Fed index is a weighted average of 85 economic indicators. 45 component indicators made positive contributions in August. Still, 40 indicators deteriorated from July’s level. Production-related indicators contributed 0.23 to the overall index in August, down from 1.26 in the prior month. Employment-related indicators added 0.63, down from 0.65 in July.
Orders for goods expected to last at least a minimum of three years, so-called ‘durable goods’, rose a modest 0.4% in August, the Census Bureau reported. The reading was its fourth consecutive monthly increase. Economists had expected a 1.5% rise. Stripping out transportation (planes and vehicles), orders were still up 0.4%. Excluding defense goods, orders were up 0.7%. Core capital goods orders (ex-defense and aircraft) rose 1.8% in August. This category has now risen above its pre-COVID trend. Manufacturing has rebounded well from the shutdown due to the pandemic. Chicago Fed President Charles Evans said manufacturing firms have some advantages because they have an engineering environment and are better able to keep employees safe.
Market research firm IHS Markit reported business activity rose at a slightly weaker pace in September. Markit’s composite Purchasing Managers Index (PMI) retreated 2.2 points to 54.4 this month, but still in expansion territory. In the services sector, its flash PMI ticked down to 54.6 from 55 in August. Its flash manufacturing index rose 0.4 point to 53.5 – a 20-month high. Readings above 50 indicate improving conditions. The flash estimate is based on approximately 85-90% of total survey responses each month. Chris Williamson, chief business economist at IHS Markit, stated in the report, “The question now turns to whether the economy’s strong performance can be sustained in the fourth quarter. Risks…seem tilted to the downside for the coming months as businesses await clarity with respect to both the pandemic and the election.”
International Economic News: In a national address, Canadian Prime Minister Justin Trudeau said Canada has entered a second wave of the coronavirus pandemic and warned the country was on the brink of a surge in cases if people did not follow public health guidelines. The government has already spent billions on pandemic aid, pushing this fiscal year’s forecast deficit to C$343.2 billion ($256.5 billion), which at about 16% of GDP is the largest shortfall since World War Two. New measures since then will likely tack another C$30 billion onto that, while next fiscal year’s deficit could be around C$200 billion, Doug Porter, chief economist at BMO Capital Markets, said in a note. Trudeau’s so-called ‘Speech from the Throne’ also threw in some big-ticket pledges such as a national prescription drug plan and universal childcare.
Across the Atlantic, ratings agency Fitch affirmed the United Kingdom’s Long-Term Foreign-Currency Issuer Default Rating (IDR) at ‘AA-‘ with a Negative Outlook. Fitch noted the UK’s rating balanced its high income, diversified and advanced economy against high and rising public sector indebtedness. The Negative Outlook reflects the impact the coronavirus pandemic is having on the UK economy and the resulting material deterioration in the public finances. Fitch forecasts the fiscal deficit to materially widen this year and government debt set to increase to well over 120% of GDP over the next few years. Furthermore, potential changes to the future trade relationship with the EU could constrain the post-crisis economic recovery.
On Europe’s mainland, a sharp fall in activity in the French services industry was not able to be offset by an increase in manufacturing output. This led the overall index for France to drop for the first time in four months. IHS Markit reported its composite reading for France dropped to 48.5 in September from 51.6 in August, back into contraction territory. In Germany, the pace of the economic rebound slowed but remained positive. The overall flash German PMI came in at 53.7, from 54.4 in August. Chris Williamson at Markit stated, “The main concern at present is therefore whether the weakness of the September data will intensify into the fourth quarter, and result in a slide back into recession after a frustratingly brief rebound in the third quarter.”
According to an independent survey by the China Beige Book, the economic recovery in China is only happening in part of the country. The world’s second-largest economy was the first country to get hit by the coronavirus pandemic. More than half the country shut down in early February in an effort to limit the spread of the virus, resulting in a 6.8% contraction in growth in the first quarter. As the outbreak of the disease stalled in March, businesses began to reopen, and the official gross domestic product grew 3.2% in the second quarter. Government-released data in the months since have pointed to further recovery overall. However, the report notes, “For large firms and those based in the Big 3 coastal regions surrounding Shanghai and Beijing, as well as Guangdong–the corporate elite–the economy is accelerating. This is the public face of Beijing’s recovery narrative,” the report said. “But the rest of China — most firms in most regions — are seeing a far more muted recovery.”
Japan’s government kept its economic assessment for September unchanged for the third consecutive month. Japan’s Cabinet Office stated activity was continuing to show signs of “picking up” from the slump triggered by the coronavirus. “The Japanese economy is still in a severe situation due to the novel coronavirus,” the report said, but has been “showing movements of picking up recently.” Nonetheless, the government downgraded its evaluations of private consumption for the first time since April, when it declared a state of emergency over the spread of the virus. A government official said a “standstill” was seen in consumer spending, especially in travel and food services, following a recent resurgence in virus infections.
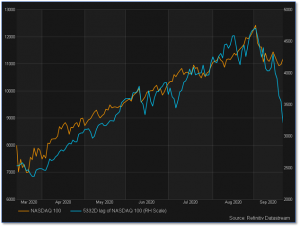
Finally: Finally, Mark Twain reportedly said “History doesn’t repeat itself, but it often rhymes”. If that holds true, the NASDAQ Composite index may be in for some pain. Michael Kramer at Mott Capital compared the recent performance of the NASDAQ to its performance at the top of the dot.com bubble of 1999. The comparison, he notes, is both “stunning and shocking” in the close similarities. From the March 2020 coronavirus-lows, the NASDAQ has rallied 84% over 163 days. That matches nearly exactly an 86% rally over 151 days by the NASDAQ at the turn of the century. As everyone knows, that rally did not end well. “I don’t know, maybe it is just chance, but still awfully strange,” Kramer wrote. Perhaps a happier outcome will be had this time.

(Sources: All index- and returns-data from Yahoo Finance; news from Reuters, Barron’s, Wall St. Journal, Bloomberg.com, ft.com, guggenheimpartners.com, zerohedge.com, ritholtz.com, markit.com, financialpost.com, Eurostat, Statistics Canada, Yahoo! Finance, stocksandnews.com, marketwatch.com, wantchinatimes.com, BBC, 361capital.com, pensionpartners.com, cnbc.com, FactSet.) Securities offered through Registered Representatives of Cambridge Investment Research Inc., a broker-dealer, member FINRA/SIPC. Advisory Services offered through Cambridge Investment Research Advisors, a Registered Investment Adviser. Strategic Investment Partners and Cambridge are not affiliated. Indices mentioned are unmanaged and cannot be invested into directly. Past performance is no guarantee of future results.
