
1-18-21 Weekly Market Update
The very Big Picture
The long-term valuation of the market is commonly measured by the Cyclically Adjusted Price to Earnings ratio, or “CAPE”, which smooths-out shorter-term earnings swings in order to get a longer-term assessment of market valuation. A CAPE level of 30 is considered to be the upper end of the normal range, and the level at which further PE-ratio expansion comes to a halt (meaning that further increases in market prices only occur as a general response to earnings increases, instead of rising “just because”). The market was recently at that level.
Of course, a “mania” could come along and drive prices higher – much higher, even – and for some years to come. Manias occur when valuation no longer seems to matter, and caution is thrown completely to the wind – as buyers rush in to buy first, and ask questions later. Two manias in the last century – the “Roaring Twenties” of the 1920s, and the “Tech Bubble” of the late 1990s – show that the sky is the limit when common sense is overcome by a blind desire to buy. But, of course, the piper must be paid, and the following decade or two were spent in Secular Bear Markets, giving most or all of the mania-gains back.
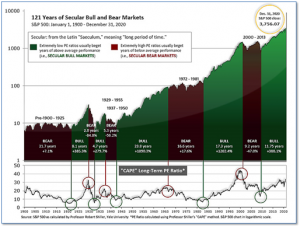
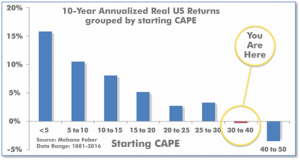
See Fig. 1 for the 100-year view of Secular Bulls and Bears. The CAPE is now at 34.26, down from the prior week’s 34.77. Since 1881, the average annual return for all ten-year periods that began with a CAPE in the 30-40 range has been slightly negative (see Fig. 2)
Note: We do not use CAPE as an official input into our methods. However, if history is any guide – and history is typically ‘some’ kind of guide – it’s always good to simply know where we are on the historic continuum, where that may lead, and what sort of expectations one may wish to hold in order to craft an investment strategy that works in any market ‘season’ … whether current one, or one that may be ‘coming soon’!
The Big Picture:
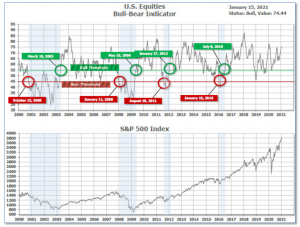
The ‘big picture’ is the (typically) years-long timeframe – the timeframe in which Cyclical Bulls and Bears operate. The U.S. Bull-Bear Indicator is in Cyclical Bull territory at 74.44 down from the prior week’s 75.44.
In the Quarterly- and Shorter-term Pictures
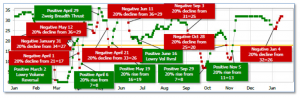
The Quarterly-Trend Indicator based on the combination of U.S. and International Equities trend-statuses at the start of each quarter – was Positive entering January, indicating positive prospects for equities in the first quarter of 2021.
Next, the short-term(weeks to months) Indicator for US Equities turned negative on January 4 and ended the week at 32, up 3 from the prior week’s 29.
In the Markets:
U.S. Markets: After hitting a fresh record intraday high on Thursday, the major benchmarks finished the week mixed. Energy stocks pulled back sharply at the end of the week but led gains within the S&P 500, helped by a surprisingly large drawdown in domestic oil inventories. The Dow Jones Industrial Average shed 283 points finishing the week at 30,814, a decline of 0.9%. The technology-heavy NASDAQ Composite fell a steeper -1.5% closing at 12,998. By market cap, the large cap S&P 500 retreated -1.5%, while the mid cap S&P 400 rose 0.3%, and small caps rallied a market-leading1.8%.
International Markets: Most international equity markets were down last week. Canada’s TSX retraced -0.7% while the United Kingdom’s FTSE 100 declined -2.0%. France’s CAC 40 and Germany’s DAX retreated -1.7% and -1.9%, respectively. In Asia, China’s Shanghai Composite ticked down -0.1%, but Japan’s Nikkei closed up for a third consecutive week adding 1.4%. As grouped by Morgan Stanley Capital International, developed markets gave up -1.8%, while emerging markets retreated -0.7%.
Commodities: Gold fell for a second week, down -0.3% to $1829.90 per ounce while Silver finished the week up 0.9% to $24.87 per ounce. Oil rose for a third consecutive week. West Texas Intermediate crude oil finished the week up 0.3% to $52.42 per barrel. The industrial metal copper, viewed by some analysts as a barometer of global economic health due to its wide variety of uses, finished the week down -2%.
U.S. Economic News: The number of Americans applying for first-time unemployment benefits soared at the beginning of the year as more workers lost their jobs due to pandemic-related business closures and government restrictions. The Labor Department reported initial jobless claims jumped by 181,000 to a seasonally-adjusted 965,000 last week. It was its highest reading since August. Economists had forecast claims to total 800,000. To put that into perspective, claims had been running in the low 200,000’s before the pandemic took hold in early spring of 2020. Continuing claims, which counts the number of Americans already receiving benefits, rose by 199,000 to 5.271 million. That number is reported with a one-week delay.
The labor market lost momentum in the final months of 2020 as layoffs rose to a five-month high. The Labor Department reported layoffs climbed by almost 300,000 to 1.97 million in November—its highest level since June. At the same time, the number of job openings fell slightly to 6.53 million. Restaurants and hotels were hit the hardest, laying off almost 400,000 employees in November. Many states reimposed restrictions on operating hours or the number of customers allowed in stores to combat the spread of coronavirus. The closely-watched “quits rate”, seen by some as a more accurate gauge of the labor market as it is presumed one would only quit a job if a more lucrative one were readily obtained, remained unchanged at 2.5% among private sector employees.
Sales at the nation’s retailers fell for a third consecutive month as a rebound in coronavirus cases at the end of the year weighed on consumers. The Census Bureau reported retail sales dropped 0.7% in December. Economists had expected only a 0.1% decline. Excluding auto dealers and gasoline, retail sales sank a steeper 2.1%. Surprisingly, internet retailers posted a 5.8% plunge in sales. That category has been one of the standout performers during the pandemic. Bars and restaurants also suffered a 4.5% drop in sales—their third decline in a row. Senior Economists Jennifer Lee at BMO Capital Markets summed up the report succinctly writing “This is a weak handoff for 2021.”
Optimism among the nation’s small business owners slipped to a seven-month low in December after a resurgence in coronavirus cases and Democratic electoral victories implied an impending dramatic shift in economic policy. The National Federation of Independent Business (NFIB) reported its sentiment index fell by 5.5 points to 95.9 last month—its lowest level since last May. Economists had expected just a slight drop to 100.0. In the report, fewer owners stated now was a good time to expand and more downgraded their sales forecasts for the next three months. NFIB chief economist Bill Dunkelberg stated, “This month’s drop in small-business optimism is historically very large, and most of the decline was due to the outlook of sales and business conditions in 2021.”
Prices of consumer goods and services rose last month at its fastest rate since last summer, predominantly due to a sharp increase in the cost of fuel, the Bureau of Labor Statistics reported. The government stated the consumer price index advanced 0.4% last month matching economists’ estimates. About 60% of the increase was tied to higher gasoline prices. The cost of food—groceries and eating out—increased 0.4% last month. Excluding gas and food, the so-called “core rate” of inflation rose a much smaller 0.1%. The core rate of inflation over the past year remained unchanged at 1.6% for the third month in a row.
Wholesale prices rose in December, primarily due to the increase in the cost of gasoline, but analysts noted few other signs of impending inflation. The government reported the producer price index increased 0.3% in December. Economists had forecast an increase of 0.4%. The cost of gasoline jumped 16%, representing about half of the increase in the price of wholesale goods last month. Prices also rose for iron, steel, meat and other forms of fuel. Over the past 12 months, the rate of wholesale inflation remained unchanged at 0.8%. Meanwhile, the core rate of inflation, which excludes food and energy, rose 0.4% in December. That reading is up 1.1% over the past year.
The Federal Reserve’s “Beige Book”, a collection of anecdotal reports from each of the Fed’s member banks, reported a third of the Fed’s districts experienced flat or declining activity at the end of the year. The majority of districts said economic activity increased only modestly. In the report, the Philadelphia and Cleveland districts reported declining activity, while activity was flat in St. Louis and Kansas City. An indication that retail inflation may be on the horizon, almost all districts reported modest price increases with many respondents stating they were able to pass some of these increases to consumers.
International Economic News: A group of Canadian economists stated that 2021 could bring rapid changes and positive job creation but agreed much of that hinges on a successful vaccine rollout and an end to the coronavirus pandemic. All things considered, 2020 wasn’t as bad as many Canadian economists first feared. Moshe Lander, economics professor at Columbia University stated, “If you told me back in March 2020 that we’d end the year still under lockdown, still under stay-at-home orders, yet we would have unemployment rates below 10 per cent, I’d high five you.” Ian Lee, professor at Carleton University remarked, “Ninety per cent of people are OK while 10 per cent were hit very, very badly. So this is not like past recessions where it affected everyone across the economy.”
Across the Atlantic, the latest official figures show the U.K. economy shrank 2.6% in November as an increase in coronavirus infections and fresh restrictions exacted a heavy toll. November’s drop was considerably less than the 5.7% contraction economists had predicted. Still, the UK’s economy remained 8.5% smaller than it was in February 2020, right before the coronavirus pandemic took hold. Since November, the UK government has tightened lockdown measures meaning more economic pain is probable. The 2.6% contraction in November, when England was placed into a month-long lockdown, followed an expansion of just 0.6% in October.
On Europe’s mainland, French Finance Minister Bruno Le Maire stated that resolving trade sanctions was his priority with the incoming U.S. administration in order to keep a trade war from erupting. U.S. President Trump’s administration had hit France with tariff duties on wine after failing to resolve a 16-year dispute over aircraft subsidies with the European Union. It also threatened tariffs on other French products over France’s digital service tax on big internet companies. Le Maire said that he had received no “initial signals” from the Biden administration about how it would deal with trade, but that he hoped to visit Washington in February.
Germany, Europe’s largest economy, reported its economy held up better during the pandemic than it did at the end of the global financial crisis. Germany’s Federal Statistics Office forecast a 5% contraction in the economy in 2020 based on provisional GDP estimates. By comparison, Germany’s economy shrank 5.7% in 2009. Spending by households tumbled and business investment shrank the most since the financial crisis. Exports and imports of goods and services decreased for the first time since 2009, shrinking 9.9% and 8.6% respectively. However, analysts noted the shallower than expected drop in GDP demonstrates the value of Germany’s industrial backbone, which makes it less reliant on services and consumption than countries such as its European neighbors and the United States.
In Asia, China’s economy continued to accelerate barely a year since its first coronavirus lockdowns. A Bloomberg survey of economists stated the world’s second-largest economy is expected to report gross domestic product increased 2.1% in 2020—the world’s only major economy that managed to avoid contraction. Furthermore, the trend is not expected to reverse once other large economies begin their recoveries. Economists expected China’s GDP will expand 8.2% this year, continuing to outpace other major economies including the U.S.
Taro Kono, a prominent Japanese cabinet minister, stated Japan may consider a fresh economic stimulus as the government expands its state of emergency amid a record surge in coronavirus infections. “Suddenly demand has gone, so I think the government, if it is necessary, will be willing to inject money into the economy,” Kono said in an interview. Prime Minister Yoshihide Suga expanded a state of emergency from the Tokyo area to seven more prefectures amid criticism that his government had acted too slowly to curb the pandemic. So far, the Japanese government has committed to spending about $3 trillion to help its economy recover from its pandemic-induced slump.
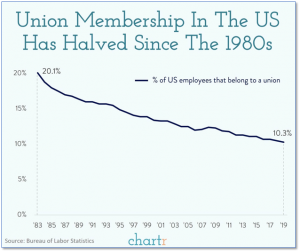
Finally: In America’s manufacturing heyday of the 1950’s, more than one-third of all American workers belonged to a union. It was down to 20% in the 1980’s, and last year that number had fallen to just 10% – with the overwhelming majority now made up of teachers, service employees, and public sector employees. One huge area of the economy that has remained steadfastly union-free is the white-collar tech, and particularly software, sector. Perhaps a portent of change for that industry occurred on January 4th when a group calling itself the Alphabet Workers Union (AWU) emerged from secrecy and formally declared itself a legitimate union of Google employees (Alphabet, Inc. is the parent company of Google). (Data from BLS, chart from chartr.co)
(Sources: All index- and returns-data from Yahoo Finance; news from Reuters, Barron’s, Wall St. Journal, Bloomberg.com, ft.com, guggenheimpartners.com, zerohedge.com, ritholtz.com, markit.com, financialpost.com, Eurostat, Statistics Canada, Yahoo! Finance, stocksandnews.com, marketwatch.com, wantchinatimes.com, BBC, 361capital.com, pensionpartners.com, cnbc.com, CNBC, FactSet.) Securities offered through Registered Representatives of Cambridge Investment Research Inc., a broker-dealer, member FINRA/SIPC. Advisory Services offered through Cambridge Investment Research Advisors, a Registered Investment Adviser. Strategic Investment Partners and Cambridge are not affiliated. Indices mentioned are unmanaged and cannot be invested into directly. Past performance is no guarantee of future results.