
8-26-19 Weekly Market Update
The Very Big Picture:
The long-term valuation of the market is commonly measured by the Cyclically Adjusted Price to Earnings ratio, or “CAPE”, which smooths out shorter-term earnings swings in order to get a longer-term assessment of market valuation. A CAPE level of 30 is considered to be the upper end of the normal range, and the level at which further PE-ratio expansion comes to a halt (meaning that increases in market prices only occur in a general response to earnings increases, instead of rising “just because”). The market is currently at that level.
Of course, a “mania” could come along and drive prices higher – much higher, even – and for some years to come. Manias occur when valuation no longer seems to matter, and caution is thrown completely to the wind as buyers rush in to buy first and ask questions later. Two manias in the last century – the 1920’s “Roaring Twenties” and the 1990’s “Tech Bubble” – show that the sky is the limit when common sense is overcome by a blind desire to buy. But, of course, the piper must be paid and the following decade or two are spent in Secular Bear Markets, giving most or all of the mania gains back.
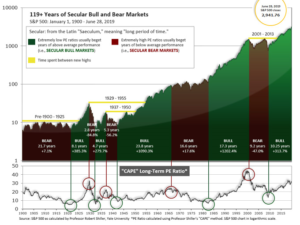
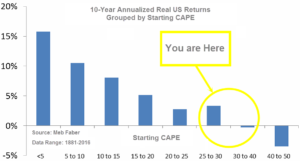
See Fig. 1 for the 100-year view of Secular Bulls and Bears. The CAPE is now at 28.55, down from the prior week’s 28.95, above the level reached at the pre-crash high in October, 2007. Since 1881, the average annual return for all ten year periods that began with a CAPE around this level have been in the 0% – 3%/yr. range. (see Fig. 2).
In the Big Picture:
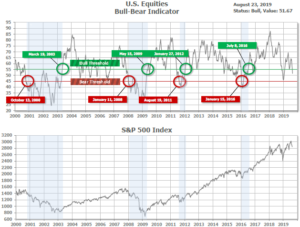
The “big picture” is the months-to-years timeframe – the timeframe in which Cyclical Bulls and Bears operate. The U.S. Bull-Bear Indicator (see Fig. 3) is in Cyclical Bull territory at 51.67, down from the prior week’s 55.13.
In the Intermediate and Shorter-term Picture:
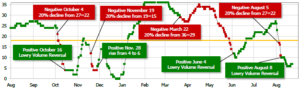
The Shorter-term (weeks to months) Indicator (see Fig. 4) is positive. The indicator ended the week at 7, up from the prior week’s 6. Separately, the Intermediate-term Quarterly Trend Indicator – based on domestic and international stock trend status at the start of each quarter – was positive entering July, indicating positive prospects for equities in the third quarter of 2019.
Timeframe summary:
In the Secular (years to decades) timeframe (Figs. 1 & 2), the long-term valuation of the market is historically too high to sustain rip-roaring multi-year returns. The Bull-Bear Indicator (months to years) remains positive (Fig. 3), indicating a potential uptrend in the longer timeframe. In the intermediate timeframe, the Quarterly Trend Indicator (months to quarters) is positive for Q3, and the shorter (weeks to months) timeframe (Fig. 4) is positive. Therefore, with three indicators positive and none negative, the U.S. equity markets are rated as Positive.
In the Markets:
U.S. Markets: U.S. markets suffered their fourth consecutive week of losses as the lingering trade dispute between China and the U.S. escalated dramatically at the end of the week. Friday started with China announcing retaliatory tariffs on $75 billion worth of U.S. goods. President Trump responded in a torrent of tweets that “American companies are hereby ordered to immediately start looking for an alternative to China…” – sending financial markets into a tailspin. The Dow Jones Industrial Average retreated -1.0% to end the week at 25,629. The technology-heavy NASDAQ Composite fell a steeper -1.8% and closed at 7,751. By market cap, large caps fared the best with the S&P 500 finishing down -1.4%, while the mid cap S&P 400 and small cap Russell 2000 retreated -2.0% and -2.3%, respectively.
International Markets: International markets were a mixed bag of gains and losses. Canada’s TSX and the UK’s FTSE finished down -0.7% and -0.3%, respectively, but major markets on the European mainland were mostly up. France’s CAC 40 rose 0.5% and Germany’s DAX added 0.4%. Italy’s Milan FTSE gained 0.7%. In Asia, China’s Shanghai Composite rebounded 2.6% while Japan’s Nikkei rose 1.4%. As grouped by Morgan Stanley Capital International, developed markets gave up -0.5% last week, while emerging markets retreated -1.2%.
Commodities: Precious metals continued to benefit from the woes of the financial markets. Gold rose $14 to $1537.60 per ounce, a gain of 0.9%. Silver rose 1.7% to $17.41 per ounce. Energy, though, retraced all of last week’s gain and finished the week lower. West Texas Intermediate crude oil finished the week down -1.2% to $54.17 per barrel. The industrial metal copper, seen by analysts as an indicator of global economic health due to its wide variety of uses, retreated -2.5%.
U.S. Economic News: The number of Americans seeking first-time unemployment benefits fell last week, suggesting a slower economy has yet to impact the country’s labor market. The Labor Department reported initial jobless claims declined by 12,000 to 209,000—back to near 50-year lows. Economists expected claims to total a seasonally-adjusted 215,000. The less volatile monthly average of new claims remained relatively unchanged, rising just 500 to 214,500. Continuing claims, which counts the number of people already receiving benefits, fell by 54,000 to 1.67 million. That number also remains near a 40-year low.
Sales of existing homes rose 2.5% last month, a positive reversal after total sales were down the previous month the National Association of Realtors (NAR) reported. Although transactions in the Northeast declined, the other three major U.S. regions all recorded sales increases. Total sales were at a seasonally-adjusted annual rate of 5.42 million in July, up 0.6% from the same time last year. NAR chief economist Lawrence Yun attributed the increase to lower mortgage rates stating, “Falling mortgage rates are improving housing affordability and nudging buyers into the market; however, the supply of affordable housing is severely low.” The median existing-home price for all housing types in July was $280,800, up 4.3% from July 2018 ($269,300). July’s price increase marks the 89th straight month of year-over-year gains.
Manufacturing activity in the U.S. fell into contraction for the first time since September of 2009, according to research firm Markit. Markit reported its Flash Manufacturing Purchasing Managers’ Index (PMI) fell 0.5 points to 49.9 this month, with the components that measure new orders and exports both shrinking at their fastest pace in a decade. The collapse in demand was attributed to weakness in the auto sector and overall global economy. Inventories also adjusted lower as uncertainty continued to grow over future demand.
For the services side of the economy, which makes up the vast majority of the U.S. economy, Markit reported its flash PMI dropped 2.1 points to 50.9, remaining just barely in expansion. The reading was a three-month low. In the details, new orders were the weakest since March of 2016 and backlogs declined for the first time this year. Both indicators suggest weaker demand going forward. Furthermore, business expectations for the next 12 months were at their lowest level since data started being tracked nearly a decade ago.
Minutes from the Federal Reserve’s Open Market Committee (FOMC) meeting in July revealed that Fed officials agreed to cut short-term interest rates but that the cut was a “recalibration” rather than a “pre-set course” for more easing. The minutes also showed that two members were in favor of a 50 basis point cut, based primarily on weak inflation readings. The summary indicated that policymakers viewed the move as a “mid-cycle adjustment,” an expression Chairman Jerome Powell used in a news conference afterward that was seen as contributing to a stock market sell-off after the July 30-31 meeting. Markets had been pricing in an interest rate easing cycle, so Powell’s use of the term raised concern that the Fed might not be as accommodative with policy as had been priced in. This is old news now, of course, but ultimately the FOMC voted to lower the central bank’s benchmark rate by 25 basis points to a target range of 2% to 2.5%. It was the first rate cut in 11 years, dating to the financial crisis.
International Economic News: More economists are coming around to the view that the Bank of Canada will, indeed, have to cut rates this year. David Doyle, an economist at Macquarie Capital Markets in Toronto stated that a slowing Canadian economy, along with deterioration in global demand and growing trade tensions, suggest a downward move in interest rates from the central bank is likely to happen more quickly than currently expected. Implied odds show investors are assigning only a 20% chance of a cut at the central bank’s next decision on Sept. 4. One rate cut by December is fully priced in, as is one more cut by June next year. That may not be quick enough, especially with the country’s yield curve inverting to the point that historically has presaged central bank easing, Doyle said.
President Trump and other world leaders arrived in France for the annual Group of Seven (G7) summit. Before leaving for France President Trump also threatened to impose levies on French wine. That threat was in response to a French proposal to tax U.S. technology companies. French President Emmanuel Macron stated the two would have lunch and discuss “a lot of crisis”. Top of the agenda would be the “economic global situation,” Macron said, and how to “decrease tensions and fix the situation in terms of trade.” Macron said that the two also would talk about Libya, Syria, Ukraine, North Korea and Iran and that climate change would be another “hot topic” on the table.
German manufacturers are signaling that Europe’s largest economy is headed into recession according to the latest data from research firm IHS Markit. Markit reported orders at Germany’s factories and services companies are dropping at their fastest pace in six years, and now more companies expect output to fall rather than to rise over the next 12 months. That’s the first time that’s happened in five years. Analysts say the German government, however, has made only tentative steps towards a fiscal stimulus program to support growth. Carsten Brzeski, chief German economist at ING in Frankfurt stated, “Somehow they are not looking at this data – the German government should react. We have this stagnation of the entire economy now and we really need some fiscal stimulus.”
China signaled this week that it could take bigger steps to boost its economy, if needed, after announcing what amounted to the slimmest of rate cuts on new loans for companies. Liu Guoquiang, deputy governor of the People’s Bank of China (PBOC) stated, “There is room for us to cut interest rates. But whether we do it or not depends on the economic growth and price conditions.” The PBOC set its new one-year Loan Prime Rate (LPR) at 4.25% this week, just slightly lower than the existing benchmark one-year lending rate of 4.35% (which hadn’t changed in years). The LPR, which will become the new benchmark for banks to price loans, is supposed to better reflect changes in market rates, and has been described by some analysts as a rate cut. “While this should nudge banks to reduce lending rates slightly, the impact on economic activity will be marginal,” wrote Julian Evans-Pritchard, senior China economist for Capital Economics.
Exports from Japan – the world’s third-largest economy – fell for an eighth consecutive month in July as slowing economic growth and trade disputes raise fears of a global recession. Japan’s Finance Ministry reported the value of shipments abroad last month were down -1.6% from the same time last year. Economists had anticipated a ‑2.3% decline. In the details, exports of auto parts and chip-making equipment fared the worst, down by -11% and -14%, respectively. Imports into Japan were also down -1.2%. Japan’s economic situation is growing increasingly precarious as it is embarking on its own escalating trade dispute with South Korea. The trade dispute appears to have been originally been sparked by South Korea’s oft-expressed desire for reparations for atrocities committed by Japan during its occupation of the Korean peninsula from 1910 to 1945.
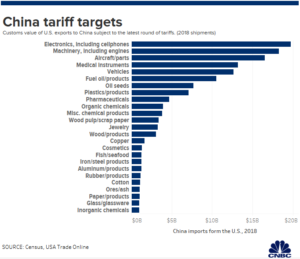
Finally: Financial markets were hit with heavy selling Friday as China announced new tariffs on U.S. goods. China said it would impose new tariffs of $75 billion on U.S. imports, including a 25% levy on U.S. autos. CNBC created an infographic showing exactly which sectors were due to be hit the hardest in the new round of tariffs. The largest category of exports to be subjected to the new tariffs is electronics, which includes cellphones and semiconductors. Next is machinery, including engines. Aircraft parts round out the top three. Following the announcement, shares of major American tech companies experienced heavy selling. Apple shares dropped 4.6%, Broadcom declined 5.4%, and Nvidia fell 5.3%. In the machinery category, shares of Caterpillar ended down 3.3%. A conundrum for China is that many of the items it will impose tariffs on are subsequently exported back to the US and elsewhere as components of finished products. So China could, in effect, hurt its own exports by its tariff on imports! The chart below, from CNBC.com, shows the categories of products affected by the new tariffs.
(Sources: all index return data from Yahoo Finance; Reuters, Barron’s, Wall St Journal, Bloomberg.com, ft.com, guggenheimpartners.com, zerohedge.com, ritholtz.com, markit.com, financialpost.com, Eurostat, Statistics Canada, Yahoo! Finance, stocksandnews.com, marketwatch.com, wantchinatimes.com, BBC, 361capital.com, pensionpartners.com, cnbc.com, FactSet; Figs 1-5) Securities offered through Registered Representatives of Cambridge Investment Research Inc., a broker-dealer, member FINRA/SIPC. Advisory Services offered through Cambridge Investment Research Advisors, a Registered Investment Adviser. Strategic Investment Partners and Cambridge are not affiliated.
Indices mentioned are unmanaged and cannot be invested into directly. Past performance is no guarantee of future results. All Investing involves risk. Depending on the types of investments, there may be varying degrees of risk. Investors should be prepared to bear loss, including total loss of principal.