
9-18-2023 Weekly Market Update
The Very Big Picture
The long-term valuation of the market is commonly measured by the Cyclically Adjusted Price to Earnings ratio, or “CAPE”, which smooths-out shorter-term earnings swings in order to get a longer-term assessment of market valuation. A CAPE level of 30 is considered to be the upper end of the normal range, and the level at which further PE-ratio expansion comes to a halt (meaning that further increases in market prices only occur as a general response to earnings increases, instead of rising “just because”). The market was recently above that level and has fallen back.
Of course, a “mania” could come along and drive prices higher – much higher, even – and for some years to come. Manias occur when valuation no longer seems to matter, and caution is thrown completely to the wind – as buyers rush in to buy first, and ask questions later. Two manias in the last century – the “Roaring Twenties” of the 1920s, and the “Tech Bubble” of the late 1990s – show that the sky is the limit when common sense is overcome by a blind desire to buy. But, of course, the piper must be paid, and the following decade or two were spent in Secular Bear Markets, giving most or all of the mania-gains back.
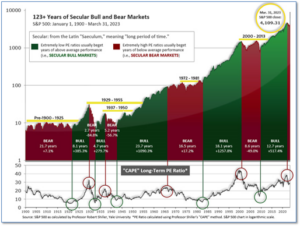
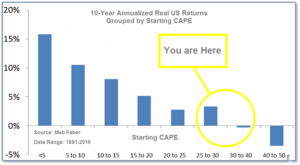
See Fig. 1 for the 100-year view of Secular Bulls and Bears. The CAPE is now at 30.59, down from the prior week’s 30.64. Since 1881, the average annual return for all ten-year periods that began with a CAPE in this range has been slightly positive to slightly negative (see Fig. 2).
Note: We do not use CAPE as an official input into our methods. However, if history is any guide – and history is typically ‘some’ kind of guide – it’s always good to simply know where we are on the historic continuum, where that may lead, and what sort of expectations one may wish to hold in order to craft an investment strategy that works in any market ‘season’ … whether the current one, or one that may be ‘coming soon’!
The Big Picture:
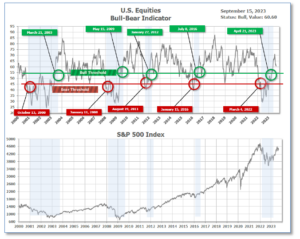
The ‘big picture’ is the (typically) years-long timeframe – the timeframe in which Cyclical Bulls and Bears operate. The U.S. Bull-Bear Indicator finished the week in Bull territory at 60.59 down from the prior week’s 61.77. (see Fig. 3)
In the Quarterly- and Shorter-term Pictures
The Quarterly-Trend Indicator based on the combination of U.S. and International Equities trend-statuses at the start of each quarter – was Positive entering July, indicating positive prospects for equities in the third quarter.
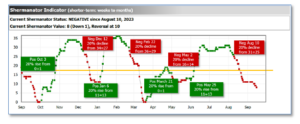
Next, the short-term(weeks to months) Indicator for US Equities turned negative on August 10, and ended the week at 8, down 3 from the prior week.
In the Markets:
U.S. Markets: The major equity indexes finished the week mixed with value stocks leading the market as U.S. benchmark West Texas Intermediate oil prices rose above $90 per barrel for the first time since November 2022. Large-cap shares outperformed small-caps. Technology and growth stocks lagged after Apple’s new product introduction event on Tuesday that featured a price increase on its top-of-the-line iPhone 15, which received mixed reviews. The Dow Jones Industrial Average ticked up 0.1% to 34,618, while the technology-heavy NASDAQ Composite shed -0.4% to 13,708. By market cap, the large cap S&P 500 retreated -0.2%, while the mid cap S&P 400 pulled back -0.3%. The small cap Russell 2000 finished the week down -0.2%.
International Markets: International markets finished the week solidly to the upside. Canada’s TSX rose 2.7%, while the UK’s FTSE 100 gained 3.1%. France’s CAC 40 and Germany’s DAX added 1.9% and 1.0% respectively. In Asia, China’s Shanghai Composite finished flat, while Japan’s Nikkei rose 2.8%. As grouped by Morgan Stanley Capital International, developed markets finished up 1.4%. Emerging markets gained 1.1%.
Commodities: Precious metals finished the week in the green as well. Gold rose 0.2% to $1946.20 per ounce, while Silver gained 0.9% to $23.39. The industrial metal copper, viewed by some analysts as a barometer of world economic health due to its wide variety of uses, finished the week up 2.3%. West Texas Intermediate crude oil gained 2.9% to $90.02 per barrel—its highest close since November of 2022.
U.S. Economic News: The number of Americans filing first-time claims for unemployment last week rose slightly as claims remain near historically low levels. The Labor Department reported initial jobless claims rose by 3,000 to 220,000. Economists had expected new claims would rise by 4,000. The four-week moving average of claims, smoothed to iron-out the weekly volatility, fell by 5,000 to 224,500. That reading is the lowest since late February. Rubeela Farooqi, chief U.S. economist at High Frequency Economics wrote in a note, “Layoffs remains low and, for now, there is no sign that businesses are shedding workers in large numbers in response to restrictive monetary policy that is aimed at weakening demand and economic activity.”
Prices for the nation’s consumers jumped 0.6% last month–their biggest increase in over a year–largely due to higher gas prices. The increase brought the annual rate of inflation up to 3.7% from 3.2% in July. On a positive note “core inflation”, which strips out food and energy, rose a smaller 0.3%. The annual rate of core inflation decelerated to 4.3% from 4.7%–its lowest level in 22 months. The August inflation report is unlikely to sway senior Fed officials ahead of their regular meeting next week at which they expected to hold a key U.S. interest rate at current levels. Some economists even think the Fed is done raising rates. The cost of gasoline surged almost 11% last month and accounted for more than half of the increase in the CPI. Falling energy prices had played a big role in the slowdown in inflation earlier in the year. Corporate economist Robert Frick of Navy Federal Credit Union stated, “This was bad news for Americans who feel inflation most acutely when filling their tanks and writing their rent checks. And given core inflation rose, it’s clear inflation around current levels may be with us for months.”
At the producer level, prices rose 0.7%, also due to higher energy costs. Economists had expected an increase of only 0.4%. Wholesale costs often foretell future inflation trends. The increase in wholesale prices over the past 12 months climbed to 1.6% from 0.8% in the prior month. “Core” wholesale prices that strips out volatile food, energy and trade margins rose 0.3% last month. That was a tick higher than expected. The increase in these so-called core prices over the past year edged up to 3% from 2.9%. Eugenio Aleman, chief economist at Raymond James noted, “While today’s worse-than-expected report can be attributed mostly to higher energy prices in August, it still shows that the Fed’s journey to bring inflation to its 2% target is not over and it will take more months of positive data to convince the Fed that it is.”
Sentiment among the nation’s small business owners fell for the first time in four months on continued concerns over inflation and difficulty finding quality labor. The National Federation of Independent Business (NFIB) reported its Small Business Optimism Index fell to 91.3 last month—its 20th consecutive month in which sentiment remained below the index’s 49-year average of 98. “With small business owners’ views about future sales growth and business conditions discouraging, owners want to hire and make money now from strong consumer spending,” said NFIB Chief Economist Bill Dunkelberg. “Inflation and the worker shortage continue to be the biggest obstacles for Main Street.” Construction, service, and manufacturing businesses reported the greatest difficulty filling open positions.
International Economic News: BMO Capital Markets expects the Canadian economy will underperform the US next year. Sal Guatieri, senior economist, and director at BMO Capital Markets, forecasts a slowdown ahead of both economies, but not simultaneously. Guatieri and the BMO team expect the strikes and wildfires this year to flatten Canadian growth for Q3. BMO’s outlook for the Canadian economy has dropped to 1.1% for this year and 0.6% for 2024. The labor and housing markets are showing signs of weakness, which are contributing to the pessimistic outlook. Guatieri stated that Canadian borrowers are sensitive to rates due to shorter-term mortgages and burdening debt. He listed weaker Canadian productivity, easing of Canadian government spending, subsidies, and tax incentives for industrial policies, and Canada’s greater dependency on goods exports, for why the Canadian economy will underperform the US.
Britain’s GDP slowed half a percent in July reversing gains from earlier this summer. Output from services, production, and construction switched to negative and dropped GDP into the red. Estimates from the Office for National Statistics show that the 0.5% growth spurt in June was reversed by the fall across all three main drivers of Britain’s services-heavy economy. Services output contracted by 0.5%, output in consumer-facing services was flat, and production output slumped 0.7% after expanding by 1.8%. Poor weather conditions in July backed up construction projects. The Office for National Statistics stated construction dropped from a 1.6% rise to contract by 0.5% solely due to a decrease in repair and maintenance, with new work only showing a slight 0.1% increase.
On a visit to Berlin, France’s finance minister Bruno Le Maire contrasted the success of the French economy to the economic setbacks on the other side of the Rhine. At an annual French-German business conference in Evian, Le Maire emphasized the success of the French economy, which German business leaders were less than thrilled about. “What’s all this Schadenfreude?” asked a German executive in the audience. Since Germany slipped into a recession in Q1, the French government has been comparing their economies. “France is becoming the locomotive of Europe,” Le Maire said after Germany confirmed the contraction of its economy in Q2. “The year 2023 is shaping up to be a difficult one, and we can legitimately be worried, particularly about the recession among our German friends,” said Le Maire.
Europe’s largest economy is expected to contract by 0.4% in 2023. According to forecasts by the European Commission, Germany is the only major European economy set for a prolonged recession this year. The commission revised May’s 0.6% economic activity estimate to 0.4% for 2023. Germany’s growth expectations for 2024 were cut from 1.4% to 1.1%. The International Monetary Fund said Germany would likely contract by 0.3% this year. As Berlin registers sharp declines in output, the traditional economic powerhouse is once again the “sick man of Europe,” which was a title coined in 1999 when Germany faced economic challenges. Holger Schmieding, chief economist at Berenberg, disagreed that Germany’s current economic troubles were comparable with prior downturns. “Germany’s situation today differs crucially from the trouble of 1995-2004…Germany enjoys record employment, high demand for labor and the most comfortable fiscal position of all major advanced economies. That makes it much easier to adjust to shocks,” Schmieding said.
Economic activity in China showed improvement last month, but its real estate market remains weak. According to the National Bureau of Statistics (NBS), recent data suggests a downturn in growth may be stabilizing. Industrial production, which measures output from sectors, increased by 4.5% annually in August. Retail sales, which measures consumption, gained a 4.6% increase from a year earlier. Investment in fixed assets, such as infrastructure and construction, grew by 3.2% this year. Property investment dropped by 8.8% over the last three quarters, according to the NBS. A major property developer, Sino-Ocean, said it would suspend repayments on its offshore borrowings, suggesting that the ongoing property crisis continues to weigh down economic expansion. In order to improve liquidity in the financial system, the People’s Bank of China made a cut to the amount of money that banks must keep in reserve by 25 basis points. “All sorts of comments predicting the collapse of China’s economy keep surfacing every now and then. But what has collapsed is such rhetoric, not China’s economy,” said Mao Ning, China’s Foreign Ministry spokesperson. She added, “China’s economy will remain a major engine for the global economy.”
Japan’s Prime Minister Fumio Kishida revealed plans for sweeping economic measures at a conference in New Delhi. To reinforce Japan’s fragile recovery, Kishida plans to reshuffle his Cabinet and compile a package of “drastic” economic measures. “On economic measures, I want them to protect the people’s lives from price hikes and to reinforce the trend of wage increases and investment expansion. I want to carry out drastic steps, supported firmly by a necessary budget,” Kishida said. Japan’s economy is not procuring the growth estimates expected in Q2 and wages slumped in July, which casted doubt upon the central bank’s projections that stable domestic demand will secure the country’s recovery.
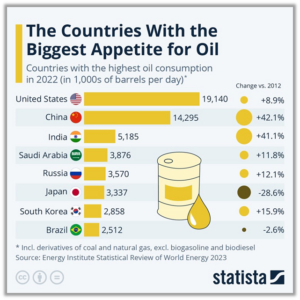
Finally: Even with renewable sources of energy gaining market share in electricity production, oil remains the world’s most important energy source when factoring transportation and heating. Using data from the International Energy Agency (IEA) analyst Florian Zandt at Statista shows 29% of the world’s energy supply came from oil. In the graphic below, two countries in particular were very heavy oil consumers in 2022. The United States consumed around 19 million barrels of oil per day, followed by its fiercest economic competitor China, which consumed around 14 million bpd. Notably, the usage of the next 8 top consumers combined only amounted to 2/3’s of the amount used by the U.S. and China.
(Sources: All index- and returns-data from Norgate Data and Commodity Systems Incorporated; news from Reuters, Barron’s, Wall St. Journal, Bloomberg.com, ft.com, guggenheimpartners.com, zerohedge.com, ritholtz.com, markit.com, financialpost.com, Eurostat, Statistics Canada, Yahoo! Finance, stocksandnews.com, marketwatch.com, wantchinatimes.com, BBC, 361capital.com, pensionpartners.com, cnbc.com, FactSet.) Content provided by WE Sherman and Company. Securities offered through Registered Representatives of Cambridge Investment Research Inc., a broker-dealer, member FINRA/SIPC. Advisory Services offered through Cambridge Investment Research Advisors, a Registered Investment Adviser. Strategic Investment Partners and Cambridge are not affiliated. Indices mentioned are unmanaged and cannot be invested into directly. Past performance is no guarantee of future results. These opinions of Strategic Investment Partners and not necessarily those of Cambridge Investment Research, are for informational purposes only and should not be construed or acted upon as individualized investment advice.