
9-11-2023 Weekly Market Update
The very Big Picture
The long-term valuation of the market is commonly measured by the Cyclically Adjusted Price to Earnings ratio, or “CAPE”, which smooths-out shorter-term earnings swings in order to get a longer-term assessment of market valuation. A CAPE level of 30 is considered to be the upper end of the normal range, and the level at which further PE-ratio expansion comes to a halt (meaning that further increases in market prices only occur as a general response to earnings increases, instead of rising “just because”). The market was recently above that level and has fallen back.
Of course, a “mania” could come along and drive prices higher – much higher, even – and for some years to come. Manias occur when valuation no longer seems to matter, and caution is thrown completely to the wind – as buyers rush in to buy first, and ask questions later. Two manias in the last century – the “Roaring Twenties” of the 1920s, and the “Tech Bubble” of the late 1990s – show that the sky is the limit when common sense is overcome by a blind desire to buy. But, of course, the piper must be paid, and the following decade or two were spent in Secular Bear Markets, giving most or all of the mania-gains back.
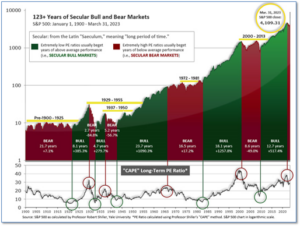
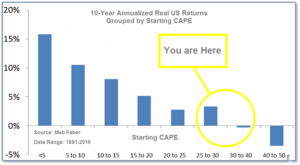
See Fig. 1 for the 100-year view of Secular Bulls and Bears. The CAPE is now at 30.64, down from the prior week’s 31.04. Since 1881, the average annual return for all ten-year periods that began with a CAPE in this range has been slightly positive to slightly negative (see Fig. 2).
Note: We do not use CAPE as an official input into our methods. However, if history is any guide – and history is typically ‘some’ kind of guide – it’s always good to simply know where we are on the historic continuum, where that may lead, and what sort of expectations one may wish to hold in order to craft an investment strategy that works in any market ‘season’ … whether the current one, or one that may be ‘coming soon’!
The Big Picture:
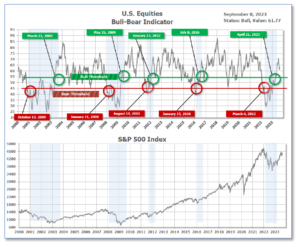
The ‘big picture’ is the (typically) years-long timeframe – the timeframe in which Cyclical Bulls and Bears operate. The U.S. Bull-Bear Indicator finished the week in Bull territory at 61.77, down from the prior week’s 62.68. (see Fig. 3)
In the Quarterly- and Shorter-term Pictures
The Quarterly-Trend Indicator based on the combination of U.S. and International Equities trend-statuses at the start of each quarter – was Positive entering July, indicating positive prospects for equities in the third quarter.
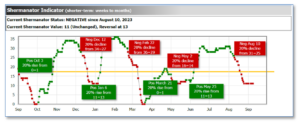
Next, the short-term(weeks to months) Indicator for US Equities turned negative on August 10, and ended the week at 11, unchanged from the prior week.
In the Markets:
U.S. Markets: Good news for the economy remains bad news for the stock market as stocks closed lower over the holiday-shortened week. Growth stocks fared better than value shares, and large caps outperformed small caps by a wider margin. The Dow Jones Industrial Average shed 261 points last week closing at 34,577, a decline of -0.7%. The technology-heavy NASDAQ Composite retreated -1.9% to 13,762. By market cap, the large cap S&P 500 declined -1.3%, while the mid cap S&P 400 and small cap Russell 2000 each shed -3.6%.
International Markets: International markets finished the week predominantly to the downside as well. Canada’s TSX fell -2.3%, while the United Kingdom’s FTSE 100 rose 0.2%. On Europe’s mainland France’s CAC 40 and Germany’s DAX pulled back -0.8% and -0.6% respectively. In Asia, China’s Shanghai Composite declined 0.5%. Japan’s Nikkei ended down -0.3%. As grouped by Morgan Stanley Capital International, developed markets closed down -1.5%. Emerging markets declined -2.3%.
Commodities: Precious metals finished the week down as well. Gold retreated -1.2% to $1942.70 per ounce. Silver declined -5.7% to $23.17. The industrial metal copper, viewed by some analysts as a barometer of world economic health due to its wide variety of uses, finished the week down -3.5%. Crude oil rose for a second consecutive week. West Texas Intermediate crude rose 2.3% to $87.51 per barrel.
U.S. Economic News: The number of Americans filing first-time claims for unemployment benefits fell to its lowest level since mid-February last week, the Labor Department reported. Initial jobless claims dropped by 13,000 to 216,000. Economists had expected new claims would rise by 2,000. Initial jobless claims have fallen four weeks in a row. Meanwhile, the number of people already collecting unemployment benefits fell by 40,000 to 1.68 million. Tom Simons, money market economist at Jefferies wrote in a note, “All signs seemed to point to higher claims, and yet they fell to the lowest level in nearly seven months. The claims data do not show any real evidence of a pickup in layoff activity. There have been brief periods of elevated counts during 2023, specifically in June, but these periods have been short-lived and often explainable by special factors.”
Growth in the vast U.S. services sector accelerated in August, according to the latest survey from the Institute for Supply Management. ISM reported its ‘services’ index jumped to 54.5 from 52.7 in the prior month, its eighth consecutive monthly gain. The reading was its highest level since February. Economists had expected the index to slip to 52.5. The details of the report were also strong. Activity improved to 57.3 in August from 57.1 in the prior month. The new orders index rose 2.5 points to 57.5 in August. The employment index rose 4 points to 54.7. Kurt Rankin, senior economist at PNC Financial Services Group stated, “Strong new orders activity is an indication that consumer and business activity in the U.S. economy continue to defy gravity — higher interest rates, accumulating debt, and depleted savings have all failed to squash services spending thus far.”
The Federal Reserve’s ‘Beige Book’, a survey of regional economic conditions from each of its member banks, reported the U.S. economy grew at a modest pace in July and August, bolstered by “the last stage of pent-up demand” for leisure activities. Outside of leisure travel, nonessential retail sales slowed, the survey said. Job growth was subdued across the country. Wage growth remained elevated but contacts in nearly all districts expect these gains to moderate in coming months. The Fed’s survey is released eight times a year, always before Fed interest-rate meetings. It is designed to give policymakers a sense of conditions “on the ground” across the country.
International Economic News: The Bank of Canada decided to hold its benchmark interest rate at 5%. According to the BoC’s Governor Tiff Macklem, recent data shows that Canada’s economy is slowing, prompting the move (or lack thereof). Gross domestic product (GDP) contracted 0.2% annually in the second quarter, falling far short of the central bank’s 1.5% expansion estimate. The Bank of Canada’s 2% annualized inflation target has proved more difficult to lower than expected. A survey by Bloomberg perceives the central bank’s next move to be an interest rate cut in the second quarter of 2024. Accompanying the BoC’s interest rates decision, officials stated their concern regarding the inflation rate and their intention to increase the policy rate, if needed. Macklem warned that more interest rate hikes may be necessary down the road.
British Chancellor of the Exchequer Jeremy Hunt says the UK’s inflation rate is on track to halve by the fourth quarter. Hunt said pressure on household budgets would settle as inflation decreases. In July, the UK’s annual consumer price inflation rate declined to 6.8%. The Bank of England forecasts inflation dropping to 4.9% by the end of the year- a faster decline than the prior forecast made in the second quarter. “I do think we may see a blip in inflation in September but after that the Bank of England is saying it will fall down to around 5%,” Hunt said. Meeting the target inflation rate would fulfill one of the pledges Prime Minister Rishi Sunak made to voters this year. As the UK approaches next year’s election, Hunt and Sunak will be striving to encourage voters’ optimism. “We are on track to halve inflation this year and by sticking to our plan we will ease the pressure on families and businesses alike,” Hunt said.
France’s industrial output rebounded in July, nearly retracing the decline in June, according to official figures. French industrial production increased by 0.8% in July, after June’s 0.9% fall. Manufacturing output grew by 0.7%, following a -1.1% in June. A rebound in production in the pharmaceuticals, wood, paper industries, and mining have raised output back to its May level. However, the August business climate survey reported that French manufacturers remain pessimistic and expect orders to shrink and production to deteriorate. Manufacturers are finding the most vital production restraint to be a lack of demand, followed by supply problems and labor shortages. Household consumption of goods rose in July, alongside an increase in tourism. The country’s sharp slowdown in demand weighed on the outlook for French industry. GDP growth is expected to remain weak over the next few quarters.
German Chancellor Olaf Scholz called on Germany to pull together and overcome the “mildew of red tape, risk averseness and despondency” that has spread across Europe’s largest economy. In a speech to the Bundestag lower house of parliament, Scholz announced a new “German pact” composed of measures intent upon reducing bureaucracy, accelerating approval processes for new construction and digitizing citizens’ accessibility to vital government services. “Citizens want orientation, courageous compromises,” Scholz said. “That is my demand of us all: the government parties that have argued too loudly in recent months and also the democratic opposition.” The chancellor rejected the idea of a new stimulus to boost an economy battling high inflation, financing costs, and a drop in exports. He said that the 2024 budget foresaw the government investing 58 billion euros from its climate fund in hydrogen, the chip industry, climate-friendly mobility, and building renovation. “I set no store in a debt-financed flash-in-the-pan so-called stimulus program that would counteract the European Central Bank’s attempts to fight inflation,” he said.
China’s exports and imports fell again last month as weak global demand adds pressure to the economy. The country’s total trade surplus slid from $80.6 billion in July to $68.36 in August. Exports last month slumped 8.8% to $284.87 billion for the fourth consecutive month of decline. Imports dropped by 7.3% to $216.51 billion. After the Federal Reserve and Europe’s central banks began raising interest rates to cool inflation, demand for Chinese exports started to weaken. Exports to the EU dropped by 10.5% annually, while imports of European goods declined 2.5% to $24.56 billion. “Looking ahead, we expect exports to decline over the coming months before bottoming out toward the end of the year,” Julian Evans-Pritchard of Capital Economics said.
Japan’s factory output fell more than expected, adding pressure on its manufacturers. Data from the Ministry of Economy, Trade, and Industry (METI) showed industrial output fell 2.0% in July from the prior month, worse than the initial forecast for a 1.4% decrease. Output of electronic devices and parts slipped by 5.1%, while production machinery dropped by 4.8%, driving the overall decline. Faltering global demand for light oil and chip-making equipment led to Japan’s first exports decline in two years. Manufacturers surveyed by the industry ministry are expecting output to increase 2.4% in September. Easing supply chain constraints for automakers allowed production of cars to increase by 0.6%. However, Masato Koike, economist at Sompo Institute Plus noted, “Production is expected to remain weak, with the possibility of further downward pressure from Toyota’s system failures that (recently) halted production at 14 domestic assembly plants.” Toyota and Honda’s extensive supplier networks have significant influence over other Japanese manufacturers.
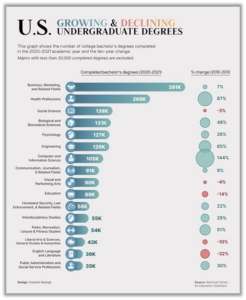
Finally: In an era of soaring college tuition and mounting student debt, choosing which undergraduate degree to pursue has become as important as ever for any aspiring college student. Based on data from the National Center for Education Statistics (NCES) Visual Capitalist’s Pallavi Rao created a graphic showing the changing landscape of undergraduate degrees awarded between 2010-2011 and 2020-2021 academic years.
(Sources: All index- and returns-data from Norgate Data and Commodity Systems Incorporated; news from Reuters, Barron’s, Wall St. Journal, Bloomberg.com, ft.com, guggenheimpartners.com, zerohedge.com, ritholtz.com, markit.com, financialpost.com, Eurostat, Statistics Canada, Yahoo! Finance, stocksandnews.com, marketwatch.com, wantchinatimes.com, BBC, 361capital.com, pensionpartners.com, cnbc.com, FactSet.) Content provided by WE Sherman and Company. Securities offered through Registered Representatives of Cambridge Investment Research Inc., a broker-dealer, member FINRA/SIPC. Advisory Services offered through Cambridge Investment Research Advisors, a Registered Investment Adviser. Strategic Investment Partners and Cambridge are not affiliated. Indices mentioned are unmanaged and cannot be invested into directly. Past performance is no guarantee of future results. These opinions of Strategic Investment Partners and not necessarily those of Cambridge Investment Research, are for informational purposes only and should not be construed or acted upon as individualized investment advice.