
8-21-2023 Weekly Market Update
The very Big Picture
The long-term valuation of the market is commonly measured by the Cyclically Adjusted Price to Earnings ratio, or “CAPE”, which smooths-out shorter-term earnings swings in order to get a longer-term assessment of market valuation. A CAPE level of 30 is considered to be the upper end of the normal range, and the level at which further PE-ratio expansion comes to a halt (meaning that further increases in market prices only occur as a general response to earnings increases, instead of rising “just because”). The market was recently above that level and has fallen back.
Of course, a “mania” could come along and drive prices higher – much higher, even – and for some years to come. Manias occur when valuation no longer seems to matter, and caution is thrown completely to the wind – as buyers rush in to buy first, and ask questions later. Two manias in the last century – the “Roaring Twenties” of the 1920s, and the “Tech Bubble” of the late 1990s – show that the sky is the limit when common sense is overcome by a blind desire to buy. But, of course, the piper must be paid, and the following decade or two were spent in Secular Bear Markets, giving most or all of the mania-gains back.
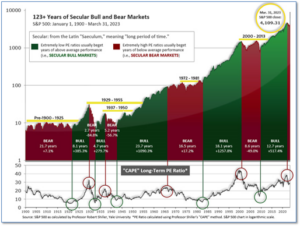
See Fig. 1 for the 100-year view of Secular Bulls and Bears. The CAPE is now at 30.14, down from the prior week’s 30.79. Since 1881, the average annual return for all ten-year periods that began with a CAPE in this range has been slightly positive to slightly negative (see Fig. 2).
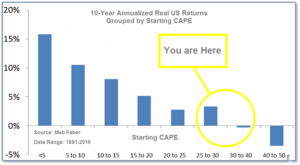
Note: We do not use CAPE as an official input into our methods. However, if history is any guide – and history is typically ‘some’ kind of guide – it’s always good to simply know where we are on the historic continuum, where that may lead, and what sort of expectations one may wish to hold in order to craft an investment strategy that works in any market ‘season’ … whether the current one, or one that may be ‘coming soon’!
The Big Picture:
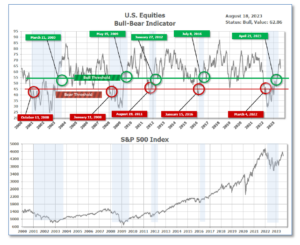
The ‘big picture’ is the (typically) years-long timeframe – the timeframe in which Cyclical Bulls and Bears operate. The U.S. Bull-Bear Indicator finished the week in Bull territory at 62.86, down from the prior week’s 66.36. (see Fig. 3)
In the Quarterly- and Shorter-term Pictures
The Quarterly-Trend Indicator based on the combination of U.S. and International Equities trend-statuses at the start of each quarter – was Positive entering July, indicating positive prospects for equities in the third quarter.
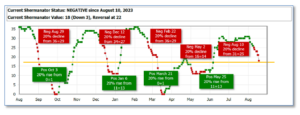
Next, the short-term(weeks to months) Indicator for US Equities turned negative on August 10, and ended the week at 18, down from the prior week’s 24.
In the Markets:
U.S. Markets: The major stock benchmarks ended the week broadly lower as sentiment appeared to take a blow from a sharp increase in longer-term bond yields and fears of an economic slowdown in China. The Dow Jones Industrial Average fell 781 points to 34,501—a decline of -2.2%. The technology-heavy NASDAQ Composite ended the week down -2.6%. By market cap, the large cap S&P 500 fell -2.1%, while the small cap Russell 2000 index fared the worst ending down -3.4%. The S&P 400 midcap index declined -3.1%.
International Markets: Major international markets ended the week in the red as well. Canada’s TSX fell -2.9%, while the United Kingdom’s FTSE 100 declined -3.5%. France and Germany pulled back -2.4% and -1.6% respectively. In Asia, China’s Shanghai Composite fell -1.8%. Japan’s Nikkei retreated -3.1%. As grouped by Morgan Stanley Capital International, developed markets declined -3.2%. Emerging markets fell -2.9%.
Commodities: Precious metals finished the week slightly down as well. Gold declined -1.6% to $1916.50 per ounce, while Silver ticked down a penny to $22.73. Copper, viewed by some analysts as a barometer of world economic health due to its wide variety of industrial uses, retreated -0.4%. Oil had its first down week after seven consecutive weeks of gains. West Texas Intermediate crude oil finished the week down -3% to $80.66 per barrel.
U.S. Economic News: The number of Americans filing first-time claims for unemployment benefits fell last week underscoring the continued strength in the labor market. The Labor Department reported initial claims for unemployment fell by 11,000 to 239,000. The reading essentially matched forecasts of 240,000. New jobless claims declined in 43 of the 53 states and territories that report these figures to the federal government. Nine others posted small upticks in new claims. Only Virginia had an increase of more than 1,000. Meanwhile, the number of people already collecting benefits climbed by 32,000 to 1.72 million. U.S. economist Thomas Simons of Jefferies said in a note, “The claims data do not show any real evidence of a pickup in layoff activity, but the lack of supply of available labor makes it increasingly difficult to fill open positions.”
Confidence among the nation’s home builders fell for the first time this year this month, despite strong demand. The National Association of Home Builders monthly confidence index fell 6 points to a reading of 50. The main culprit was a sharp rise in the 30-year mortgage rate that dampened home-buying interest. Mortgage rates are at their highest levels since November 2022. This week lenders were quoting an interest rate for a 30-year fixed-rate mortgage at 7.24%, according to Mortgage News Daily. In the report, the three gauges that make up the overall builder-confidence index all declined. Current sales conditions fell 5 points, while future sales expectations pulled back 4 points. Prospective buyer traffic was also down by 6 points. Builders are also reporting challenges with finding labor and buildable land as well as shortages in construction equipment.
Sales at the nation’s retailers posted their biggest increase in six months in July, boosted by strong sales on Amazon’s Prime Day. Retail sales rose 0.7% last month, almost double economists’ forecasts of a 0.4% rise. Retail sales represent about one-third of all consumer spending and usually offer clues on the strength of the economy. Sales at internet retailers jumped 1.9%–a second consecutive strong gain. Over the past year internet sales have risen 10.3%, more than double the rate of inflation. Sales also rose a sharp 1.4% at bars and restaurants, a positive sign for the economy as restaurant sales tend to rise when consumers feel secure in their jobs and decline during times of economic stress. However, the strong retail sales numbers mean the Federal Reserve may need to do more to tap the brakes on the economy and bring inflation down. As Senior Economist at BMO Capital Markets Jennifer Lee writes in a research note, “The Federal Reserve’s life just got a little more complicated.”
The Conference Board’s index of Leading Economic Indicators (LEI) continued its decline last month falling a further 0.4%. The biggest positive contributor to the leading index was stock prices at 0.15, while the biggest negative contributor was the Institute for Supply Management’s New Orders index at -0.18. This is the 16th straight monthly decline in the LEI–the longest streak of declines since 2008. Justyna Zabinska-La Monica, Senior Manager of Business Cycle Indicators at The Conference Board stated, “the leading index continues to suggest that economic activity is likely to decelerate and descend into mild contraction in the months ahead.” On a year-over-year basis, the LEI is down 7.5%, also close to its biggest annual decline since 2008.
Manufacturing activity in the New York-region slowed far more than expected in the latest report from the New York Federal Reserve. The NY Fed’s Empire State Business Conditions index plunged 20.1 points this month to -19, its first negative reading since May. Economists had expected a decline to just -1.4. The indexes for new orders and shipments dropped sharply in August. The index for new orders fell 23.2 points to negative 19.9. The shipments index fell 25.7 points to negative 12.3. The factory sector has been hurt by tighter lending standards, elevated borrowing costs and softening business demand. Ian Shepherdson, chief economist at Pantheon Macroeconomics noted part of the weak reading was due to “the much-discussed external boost from China’s re-opening has amounted to very little.”
International Economic News: Canada’s inflation rate rebounded last month, retracing all of June’s decline and then some. According to Statistics Canada, the country’s annual inflation rate increased to 3.3% in July. For the first time since 2021, the inflation rate had dropped to 2.8% in June, falling within the Bank of Canada’s target range between 1-3%. The federal agency pins July’s increased inflation rate on gasoline prices and food prices. Grocery prices had increased 8.5% on an annual basis, climbing steadily in June. The Bank of Canada forecasts inflation to steady around 3% through 2024, before reaching 2% by mid-2025.
Across the Atlantic, the UK’s inflation rate slowed in July, but cost pressures on households remains high. The inflation rate fell to 6.8% last month, down from 7.9% in June. While lower electricity and gas prices prompted the drop, the rising costs for flights, hotels, and eating out, have strengthened consumer expectations that interest rates will be raised again. Flight prices continue to increase, nearly reaching 30% last month from the prior year, according to the Office for National Statistics. Inflation is lower than October’s 11.1% peak but remains historically high and above the Bank of England’s 2% target. Wages rose 7.8% annually from April to June but are struggling to keep up with rising prices. Danni Hewson, head of financial analysis at British brokerage firm AJ Bell wrote in a note, “Inflation is still significantly above that 2% target and even if it is cooling off faster than a sunburnt Brit diving into a hotel pool, prices are not falling, they’re just not rising as fast as they have been.”
German investor morale unexpectedly improved in August, according to the ZEW Economic Research Institute, however it remained firmly in negative territory as the mood in Europe’s largest economy remains clouded. “The slight brightening of economic expectations is positive news, at least on the surface,” said Elmar Voelker, senior fixed income analyst at LBBW Research. The German economy stagnated in the second quarter of this year as weak purchasing power, higher interest rates, and declining factory orders, weighed. ZEW’s economic sentiment index ticked up slightly from -14.7 to ‑12.3 points last month. Analysts had expected sentiment to stagnate in August around -14.7 points. ZEW president Achim Wambach said, “These heightened expectations need to be viewed in the context of a significantly worsened assessment of the current economic situation in Germany.”
China’s banks have dialed back lending as economic struggles persist. Economists had expected Chinese banks to dole out 780 billion yuan in new loans in July, far higher than the 345.9 billion yuan it actually lent. From property and trade to manufacturing and demographics, the People’s Bank of China reported that new lending in July dropped to its lowest level since 2009. The decreasing volume suggests that demand for loans is declining, which comes on top of July’s sharp drop in aggregate financing, another measure of credit. Loans to companies dropped month-over-month to 271.2 billion yuan and loans to households shrank by 67.2 billion yuan. Housing market data showed that prices for new homes fell for the second consecutive month, as 49 out of the 70 measured cities reported month-over-month decreases. Growth in retail sales slowed from 3.1% to 2.5%. Most notably, consumer prices dropped annually in July for the first time in two years, joining producer prices in deflation territory. “Deflation means the real value of debt goes up,” David Dollar, a senior fellow at the Brookings Institute’s China center, stated in a recent interview. “High inflation we know is bad, but it does help manage debt burdens over time. Deflation does the opposite.”
Japan’s economy posted its third quarterly expansion, government data showed, lifted by robust growth in exports. The economy grew at an annualized 6% in the second quarter, easily surpassing expectations of 3.1% growth. “Japan’s economy expanded at an extremely rapid pace last quarter, but we expect a renewed slowdown across the second half of the year,” Marcel Thieliant, head of Asia-Pacific at Capital Economics, said. Exports rebounded 3.2% annually, primarily driven by a sharp increase in car shipments, while imports experienced a 4.3% drop. Inflation still exceeds the BOJ’s 2% target. Last month, the Japanese central bank loosened its yield curve control over the 10-year Japanese government bond to make its ultra-easy monetary position more sustainable. “Nearly all of the increase in output was driven by a 1.8%-pts boost from net trade. That marked the second-largest contribution from net trade in the 28-year history of the current GDP series, with only the bounce back in exports from the first lockdown at the beginning of the pandemic providing a larger boost,” Thieliant said.
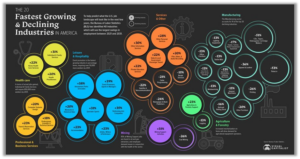
Finally: The labor force is always shifting, responding to technological or societal changes. For that reason, keeping an eye on the fastest growing industries can help workers and businesses stay on top of the crucial trends driving employment. Visual Capitalist’s Pallavi Rao examined projections from the U.S. Bureau of Labor Statistics on the fastest growing industries, as well as those that are declining the fastest. All of the top three fastest growing industries in the U.S. belong to the Leisure and Hospitality sector, followed by Health Care and Professional & Business Services. Event Promoters, Agents, and Managers top the list with an impressive predicted growth of 39%, employing over 180,000 workers by 2031. Manufacturing leads the group of industries expected to register the highest employment declines by 2031, with Tobacco manufacturing projected to decrease 53% in employment.
(Sources: All index- and returns-data from Norgate Data and Commodity Systems Incorporated; news from Reuters, Barron’s, Wall St. Journal, Bloomberg.com, ft.com, guggenheimpartners.com, zerohedge.com, ritholtz.com, markit.com, financialpost.com, Eurostat, Statistics Canada, Yahoo! Finance, stocksandnews.com, marketwatch.com, wantchinatimes.com, BBC, 361capital.com, pensionpartners.com, cnbc.com, FactSet.) Content provided by WE Sherman and Company. Securities offered through Registered Representatives of Cambridge Investment Research Inc., a broker-dealer, member FINRA/SIPC. Advisory Services offered through Cambridge Investment Research Advisors, a Registered Investment Adviser. Strategic Investment Partners and Cambridge are not affiliated. Indices mentioned are unmanaged and cannot be invested into directly. Past performance is no guarantee of future results. These opinions of Strategic Investment Partners and not necessarily those of Cambridge Investment Research, are for informational purposes only and should not be construed or acted upon as individualized investment advice.