
8-8-2022 Weekly Market Update
The very Big Picture
The long-term valuation of the market is commonly measured by the Cyclically Adjusted Price to Earnings ratio, or “CAPE”, which smooths-out shorter-term earnings swings in order to get a longer-term assessment of market valuation. A CAPE level of 30 is considered to be the upper end of the normal range, and the level at which further PE-ratio expansion comes to a halt (meaning that further increases in market prices only occur as a general response to earnings increases, instead of rising “just because”). The market is now above that level.
Of course, a “mania” could come along and drive prices higher – much higher, even – and for some years to come. Manias occur when valuation no longer seems to matter, and caution is thrown completely to the wind – as buyers rush in to buy first, and ask questions later. Two manias in the last century – the “Roaring Twenties” of the 1920s, and the “Tech Bubble” of the late 1990s – show that the sky is the limit when common sense is overcome by a blind desire to buy. But, of course, the piper must be paid, and the following decade or two were spent in Secular Bear Markets, giving most or all of the mania-gains back.
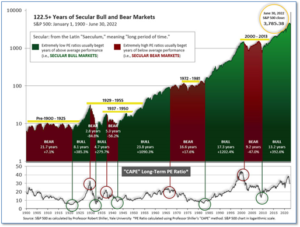
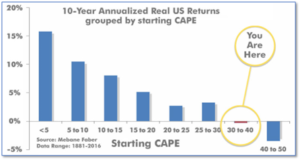
See Fig. 1 for the 100-year view of Secular Bulls and Bears. The CAPE is now at 31.10, up from the prior week’s 30.99. Since 1881, the average annual return for all ten-year periods that began with a CAPE in this range has been slightly positive to slightly negative (see Fig. 2).
Note: We do not use CAPE as an official input into our methods. However, if history is any guide – and history is typically ‘some’ kind of guide – it’s always good to simply know where we are on the historic continuum, where that may lead, and what sort of expectations one may wish to hold in order to craft an investment strategy that works in any market ‘season’ … whether the current one, or one that may be ‘coming soon’!
The Big Picture:
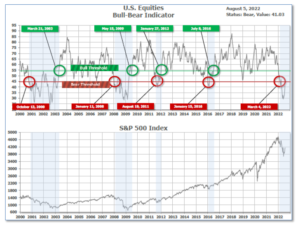
The ‘big picture’ is the (typically) years-long timeframe – the timeframe in which Cyclical Bulls and Bears operate. The U.S. Bull-Bear Indicator finished the week in Bear territory at 41.03, up from the prior week’s 37.83.
In the Quarterly- and Shorter-term Pictures
The Quarterly-Trend Indicator based on the combination of U.S. and International Equities trend-statuses at the start of each quarter – was Negative entering July, indicating negative prospects for equities in the third quarter of 2022.
Next, the short-term(weeks to months) Indicator for US Equities turned positive on June 24, and ended the week at 35, down from the prior week’s 36.
In the Markets:
U.S. Markets: The major U.S. equity benchmarks ended the week mixed after a much stronger-than-expected jobs report revived investor concerns that the Federal Reserve will maintain its aggressive pace of interest rate hikes to slow down inflation. The Dow Jones Industrial Average ticked down -0.1% to 32,803, while the technology-heavy NASDAQ Composite finished the week up 2.2%. By market cap, the large cap S&P 500 added 0.4%, the mid cap S&P 400 declined -0.3% and the small cap Russell 2000 ended the week up 1.9%.
International Markets: Like the U.S., international markets were mixed on the week. Canada’s TSX ended down -0.4%, while the United Kingdom’s FTSE 100 rose 0.2%. On Europe’s mainland, France’s CAC 40 and Germany’s DAX rose 0.4% and 0.7%, respectively, while in Asia, China’s Shanghai Composite declined -0.8%. Japan’s Nikkei closed up 1.3%. As grouped by Morgan Stanley Capital International, developed markets closed down -1.1% and emerging markets rose 0.3%.
Commodities: Energy prices dropped sharply this week with Brent crude oil falling -9% to $94.66 per barrel and West Texas Intermediate plunging -9.7% to $89.01. Gold managed to close in the green, rising 0.5% to $1791.20 per ounce. Silver ended the week down -1.8% to $19.84 per ounce. The industrial metal copper, viewed by some analysts as a barometer of world economic health due to its wide variety of uses, finished the week down -0.6%.
U.S. Economic News: The number of Americans filing for first-time unemployment benefits rose slightly last week, signaling a softening in the labor market. The Labor Department reported initial jobless claims increased by 6,000 to 260,000 in the seven days ended July 30. The reading matched economists’ expectations. New filings had fallen to as low as 166,000 in late March — the second-fewest on record — before moving higher over the past several months as the economy slowed. Many companies are still reporting difficulty finding enough qualified workers to fill open positions. Meanwhile, the number of people already collecting benefits increased by 48,000 to 1.42 million. While still remaining near a 50-year low, that reading is at its highest level since April. Money market economist Thomas Simons of Jefferies LLC noted the overall demand for labor remains strong. “The relative stability of continuing claims suggests that workers who are let go are still having a relatively easy time finding a new job,” he wrote in a note to clients.
In a red-hot report of the U.S. labor market, the economy added over half a million jobs in July and the unemployment rate fell back to pre-pandemic levels, according to the Bureau of Labor Statistics. The increase in hiring not only blew past the Wall Street median estimate of 258,000 new jobs—it was actually a 6 sigma beat to expectations. Hiring was broad-based as businesses created the most new jobs in five months. The number of people working finally returned to February 2020 levels–the last month before the pandemic. The unemployment rate ticked down to 3.5% from 3.6%, matching the lowest level since the late 1960’s. Seema Shah, chief global strategist at Principal Global Investors stated, “All the jobs lost during the pandemic have now been regained.” However, that doesn’t necessarily translate into good news for the stock market. The strong jobs report gives the Federal Reserve the green light to continue its rate-hike trajectory. One concern in the report, more people continued to drop out of the labor force. The labor force participation rate fell again to a seven-month low of 62.1%–the lowest level since the end of 2021.
The number of job openings dropped below 11 million for the first time since last fall, signaling the red-hot labor market may finally be cooling off as the economy slows. The Labor Department reported job openings slipped from 11.3 million in May to 10.7 million in June—its third consecutive month of declines. The last time job openings were below 11 million was November of last year. Job openings fell the most in retail (-343,000), wholesaling (-82,000) and state and local government (-62,000). Most other industries saw little change. Also in the report, the “quits rate”, fell only slightly to 4.23 million. The number of people quitting their jobs topped 4 million a year ago for the first time ever, part of a pandemic-era trend known as the “Great Resignation”. Before the pandemic, the number of people quitting their jobs averaged fewer than 3 million per month. Layoffs remained near their historically low levels. Stephen Stanley, chief economist at Amherst Pierpont Securities noted, “If the economy is rolling over, the labor market had apparently not gotten the memo yet as of the end of June.”
Factory activity grew at its slowest pace in two years, an ominous sign of weakness in the U.S. economy, a closely followed survey showed. The Institute for Supply Management (ISM) reported its Purchasing Managers’ Index (PMI) for manufacturing companies ticked down to 52.8 in July from 53.0 the month before. Economists had expected a reading of 52.1. While readings above 50 signify growth, the latest reading was the weakest since June of 2020. In addition, the index declined for a third consecutive month. On a positive note, the report stated there was some relief on the inflation front. Most of that was due to the recent decline in energy prices. Of most concern, the ‘new orders’ index slid 1.2 points to 48—its lowest level since May 2020.
Companies in the vast ‘services’ side of the U.S. economy continued to grow in July, according to the latest data from the Institute for Supply Management (ISM). ISM’s Purchasing Managers’ Index for services companies, such as restaurants and hotels, rose 1.4 points to a three-month high of 56.7 last month. The reading suggests the economy continues to expand despite growing headwinds. Orders and production rose, hiring improved, and inflation pressures eased somewhat, the report noted. The reading was a surprise to the upside—economists had expected the index to drop to 54. In the details of the report, the new orders index rose 4.3 points to 59.9—a four-month high. The report supports the Fed’s view that a “soft-landing” for the economy may indeed be possible. Lead U.S. economist at Oxford Economics Oren Klatchkin wrote in a note, “The recovery’s best days are clearly in the rear-view mirror, but this doesn’t mean an economic downturn has begun.”
International Economic News: Canada’s economy unexpectedly lost jobs for the second month in a row in July. Statistics Canada reported Canada’s economy lost 30,600 jobs last month, coming on the heels of a 43,000 loss in June. Economists had expected a slight gain of about 15,000 new jobs. The health care sector was a major drag in the report, losing 22,000 positions. Burnout and job churn in Canada’s healthcare sector has become a major issue. More than 10% of all nurses called in sick at least once during the month, and more than 20% worked paid overtime to make up for it, the data agency said. Despite the decline, the jobless rate held steady at its record low of 4.9%, because while there were fewer jobs, there were also fewer people looking for work.
Across the Atlantic, the Bank of England warned that the United Kingdom faces a “very big” inflation shock as it raised interest rates by the most in 27 years. Governor Andrew Bailey said he knew the cost of living squeeze was difficult but if it didn’t raise interest rates it would get “even worse”. The Bank of England raised interest rates 50 basis points Thursday, taking borrowing costs to 1.75% in an ongoing bid to curb soaring inflation. Bailey said that the risks of high inflation becoming persistent had risen since the Bank’s previous meeting in June, prompting it to take “stronger action.” In addition, the Bank of England issued a dire outlook for U.K. economic growth, predicting that the country will enter recession from the fourth quarter of 2022, with the downturn expected to last for five quarters.
On Europe’s mainland, French power giant Electricite de France SA (EDF) warned that it’s likely to extend cutbacks to its nuclear power generation due to extraordinarily hot weather conditions. According to the French utility, power stations on the Rhone and Garonne rivers will likely produce less electricity over the next few days, but there will be a minimum output to keep things running. Heatwaves are raising river temperatures, which makes it difficult for EDF, which uses river water to cool reactors. Analysts state this could exacerbate the worst energy shortage in Europe in decades, fueled by Russia’s retaliatory gas cuts. France and Germany are already at record levels for power prices, and the output reductions are likely to make them even higher.
Retail sales volumes in Germany fell at their largest annual rate since records began in 1994, highlighting the economic challenges facing Europe’s economic powerhouse. Retail sales plunged 8.8% in June from the same time last year, according to Germany’s national statistics agency Destatis. Claus Vistesen, chief Eurozone economist at Pantheon Macroeconomics, said the figures were “miserable” and mainly due to the impact of soaring prices on consumer spending. Inflation in Germany is at a multi-decade high of 8.5%. The plunge in retail sales followed reports that German economic growth stagnated between the first and second quarters, and figures showing that business and consumer confidence is now at its lowest level since the early months of the pandemic.
The world’s second biggest economy, China, slowed in July according to a myriad of reports. A private poll by Caixin showed manufacturing activity grew more slowly than expected in July. However, the report followed an extraordinarily strong reading in June that followed strict COVID lockdowns. The Caixin report came after an official government survey that showed factory activity actually contracted in July. In addition, a poll by China Index Academy, one of the country’s largest independent real estate research firms, showed property sales slumped 33.4% in July after a post-lockdown surge of 88.9% in June. The country’s top leaders signaled the government’s growth target of 5.5% for 2022 is looking increasingly unlikely.
Spending by Japan’s households rose for the first time in four months, a positive sign for the broader economy. Government data showed spending jumped by 3.5% in June from the same time last year, its first year-over-year increase since January. Economists had expected just a 1.5% increase. Spending increased predominantly in travel services and transportation. Still, while the report was stronger than expected, analysts noted it was unlikely to dispel worries that Japan’s recovery will remain slower than other leading economies such as the U.S. A private sector survey earlier this week showed growth in activity in the services sector stalling in July as rising inflation and uncertainty about the global economy hurt demand.
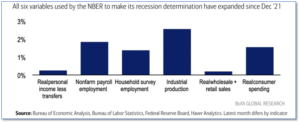
Finally: The popular definition of an economic recession has traditionally been “two consecutive quarters of negative real gross domestic product (GDP) growth”, but economists at Bank of America’s Global Research team aren’t expecting an official ‘recession’ call anytime soon. They note that the National Bureau of Economic Research (NBER), which is the official arbiter of recessions, doesn’t use that “popular definition”. Instead, the NBER recession committee broadly defines a recession as a “significant decline in economic activity spreading across the economy, lasting more than a few months.” So, if it’s not strictly GDP, what other measurements does the NBER committee look at? BofA’s team shared six of the main variables the NBER uses in making its determination. And a casual glance explains why they’re not expecting the NBER to declare a recession anytime soon – all six measures are up since the start of the year! (Chart from BofA Global Research via Yahoo Finance)
(Sources: All index- and returns-data from Yahoo Finance; news from Reuters, Barron’s, Wall St. Journal, Bloomberg.com, ft.com, guggenheimpartners.com, zerohedge.com, ritholtz.com, markit.com, financialpost.com, Eurostat,0020Statistics Canada, Yahoo! Finance, stocksandnews.com, marketwatch.com, wantchinatimes.com, BBC, 361capital.com, pensionpartners.com, cnbc.com, FactSet.) Content provided by WE Sherman and Company. Securities offered through Registered Representatives of Cambridge Investment Research Inc., a broker-dealer, member FINRA/SIPC. Advisory Services offered through Cambridge Investment Research Advisors, a Registered Investment Adviser. Strategic Investment Partners and Cambridge are not affiliated. Indices mentioned are unmanaged and cannot be invested into directly. Past performance is no guarantee of future results.