
8-15-2022 Weekly Market Update
The Very Big Picture
The long-term valuation of the market is commonly measured by the Cyclically Adjusted Price to Earnings ratio, or “CAPE”, which smooths-out shorter-term earnings swings in order to get a longer-term assessment of market valuation. A CAPE level of 30 is considered to be the upper end of the normal range, and the level at which further PE-ratio expansion comes to a halt (meaning that further increases in market prices only occur as a general response to earnings increases, instead of rising “just because”). The market is now above that level.
Of course, a “mania” could come along and drive prices higher – much higher, even – and for some years to come. Manias occur when valuation no longer seems to matter, and caution is thrown completely to the wind – as buyers rush in to buy first, and ask questions later. Two manias in the last century – the “Roaring Twenties” of the 1920s, and the “Tech Bubble” of the late 1990s – show that the sky is the limit when common sense is overcome by a blind desire to buy. But, of course, the piper must be paid, and the following decade or two were spent in Secular Bear Markets, giving most or all of the mania-gains back.
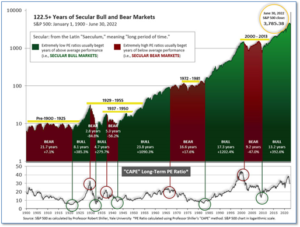
See Fig. 1 for the 100-year view of Secular Bulls and Bears. The CAPE is now at 32.07, up from the prior week’s 31.10. Since 1881, the average annual return for all ten-year periods that began with a CAPE in this range has been slightly negative (see Fig. 2).
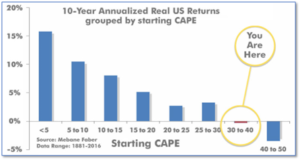
Note: We do not use CAPE as an official input into our methods. However, if history is any guide – and history is typically ‘some’ kind of guide – it’s always good to simply know where we are on the historic continuum, where that may lead, and what sort of expectations one may wish to hold in order to craft an investment strategy that works in any market ‘season’ … whether the current one, or one that may be ‘coming soon’!
The Big Picture:
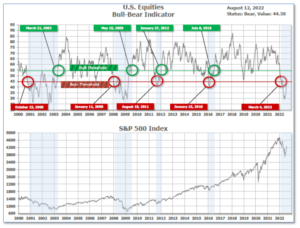
The ‘big picture’ is the (typically) years-long timeframe – the timeframe in which Cyclical Bulls and Bears operate. The U.S. Bull-Bear Indicator finished the week in Bear territory at 44.38, up from the prior week’s 41.03.
In the Quarterly- and Shorter-term Pictures
The Quarterly-Trend Indicator based on the combination of U.S. and International Equities trend-statuses at the start of each quarter – was Negative entering July, indicating negative prospects for equities in the third quarter of 2022.
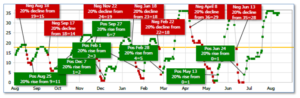
Next, the short-term(weeks to months) Indicator for US Equities turned positive on June 24, and ended the week at 35, unchanged from the prior week.
In the Markets:
U.S. Markets: U.S. stocks rallied after data showed signs that inflation had started to slow, supporting the view that the rise in the consumer prices may have peaked. Federal Reserve officials reiterated that the central bank still had work to do in taming inflation, but the market nonetheless appeared to lower its expectations for a 75-basis-point (0.75%) rate hike in September. The Dow Jones Industrial Average finished the week up 958 points, finishing at 33,761, a gain of 2.9%. The technology-heavy NASDAQ Composite rallied 3.1% to close at 13,047. By market cap, the large cap S&P 500 added 3.3%, while the mid cap S&P 400 surged 4.4% and the small cap Russell 2000 finished the week up 4.9%.
International Markets: Major international markets were all positive for the week. Canada’s TSX rose 2.9%, while the United Kingdom’s FTSE 100 added 0.8%. On Europe’s mainland, France’s CAC 40 and Germany’s DAX added 1.3% and 1.6%, respectively. In Asia, China’s Shanghai Composite rose 1.5%, logging its first positive week in three. Japan’s Nikkei finished the week up 1.3%. As grouped by Morgan Stanley Capital International, developed markets added 2.7%. Emerging markets finished up 2.5%.
Commodities: Major commodities finished the week to the upside as well. Precious metals were higher with Gold rising 1.4% to $1815.50 per ounce and Silver added 4.3% to $20.70. Energy retraced some of last week’s declines. Brent crude oil rebounded 3.5% to $98 per barrel, while West Texas Intermediate crude added 3.5% to $92.09. The industrial metal copper, viewed by some analysts as a barometer of world economic health due to its wide variety of uses, finished the week up 3.3%.
U.S. Economic News: The number of Americans filing for first-time unemployment benefits rose to its highest level since last November, another sign of the cooling labor market. The Labor Department reported initial jobless benefits rose by 14,000 to 262,000 last week. Economists had expected just an increase of 4,000 new claims. The four-week moving average of claims, smoothed to iron-out the weekly volatility, rose by 4,500 to 252,000. Claims have been slowly trending higher over the past few months, consistent with softening demand for workers. The Federal Reserve has been intent on cooling the labor market to help get the rate of inflation under control. Stuart Hoffman, senior economic advisor at PNC Financial Services Group wrote in a research note, “The rise in initial claims since early April is a cool breeze blowing at the hot labor market this summer.”
Confidence among the nation’s small business owners rose last month, reflecting improved expectations about business conditions. The National Federation of Independent Businesses (NFIB), a small-business lobbying group, reported its Small Business Optimism Index climbed 0.4 points to 89.9 in July. Economists were expecting the index to remain unchanged. Of the 10 index components, four increased while six decreased. Inflation remained a key concern, with 37% of small business owners reporting it as their single most important problem in operating their business. That reading was at its highest level since the end of 1979. On a positive note, the sub-index that measures the percentage of owners expecting better business conditions over the next six months recorded the biggest rise, up nine points from June’s record low.
Consumers got a reprieve from higher prices in July, according to the latest report from the government. The Labor Department’s Consumer Price Index (CPI) remained unchanged in July, down from a 1.3% increase the prior month and below economists’ expectations of a 0.2% advance. Over the past year, inflation retreated to 8.5% from its 41-year high of 9.1% in June. The closely-watched “core” measure of inflation that omits volatile food and energy rose 0.3% in July, down from a 0.7% gain in the prior month. The 12-month rate remained steady at 5.9%. The big rise in inflation was the cost of food, which rose 1.1% in July. Over the past year, food prices alone are up 10.9%, the highest since May 1979. Energy prices fell 4.6% in July, with gasoline prices down 7.7%. Sal Guatieri, senior economist at BMO Capital Markets wrote, “The July CPI report may be the first clear indication that consumers are pushing back against high inflation in response to tighter monetary policy.” In addition, he stated his view that inflation was close to peaking, though the “climb down the mountain will be slow.”
Prices at the wholesale level pulled back as well, implying more good news for consumer prices in the near future. The Labor Department reported its Producer Price Index fell -0.5% in July, its first negative monthly print since April of 2020. The reading was a surprise to the downside–economists had expected an increase of 0.2%. In annual terms, the headline PPI was up 9.8% in July, down from 11.3% in the prior month. The core producer price index, which excludes volatile food and energy prices, rose 0.2% in July, down from a 0.3% gain in the prior month. The decline appears to be largely result in the decline in energy prices. Energy prices dropped 9% in July, down sharply from their 9.4% gain in the prior month.
A survey of U.S. consumers showed sentiment rose in August, but remains near its all-time low seen in July. The University of Michigan’s index of Consumer Sentiment rose to 55.1 in its preliminary reading for this month—up 4 points from July. Economists had expected a reading of just 52.5. Consumer expectations for inflation over the next year ticked down to 5% from 5.2% last month, while expectations for inflation over the next five years ticked up to 3% from 2.9% in July, which was a six-month low. Americans remain concerned about the rapidly rising costs of key goods like food and rent, though declines in the price of gasoline in recent weeks helped lift the national mood. “All components of the expectations index improved this month, particularly among low and middle-income consumers for whom inflation is particularly salient,” wrote Joanne Hsu, director of the survey.
In a pair of speeches by Federal Reserve governors, Charles Evans, President of the Federal Reserve Bank of Chicago stated the July CPI data was “positive”, but “nobody can be happy” with an 8.5% annual inflation rate. Evans now sees the Fed’s benchmark policy rate rising to 3.25% – 3.5% by end of year, implying a slower pace of hikes ahead. On the economy, Evans said he didn’t think the economy would “turn down in a significant fashion anytime soon.” Minneapolis Fed President Neel Kashkari stated July’s CPI print was the “first hint” of possible good news on the inflation front. “I was certainly happier to see a surprise to the downside,” Kashkari said, but the Fed is “far, far away from declaring victory,” he added.
International Economic News: Canada’s inverted yield curve is signaling the Bank of Canada may be forced to raise interest rates to a level that almost guarantees a recession, analysts say. The yield on Canada’s 10-year government bond has fallen more than 50 basis points below its 2-year yield—the biggest inversion since 1994. Analysts see yield curve inversions as predictors of recessions. Furthermore, Canada’s economy is likely to be particularly sensitive to higher interest rates after Canadians borrowed heavily during the pandemic to participate in its red-hot housing market.
Britain’s Christopher Dembik, Saxo Bank’s head of Macro Analysis, wrote in a scathing research note that a currency crisis is the only thing missing in the United Kingdom resembling an “emerging-market economy”. Dembik stated that adding up inflation, political instability following former Prime Minister Boris Johnson’s departure, trade disruptions, and an unstable energy market, the British economy resembles one from the developing world rather than the sixth largest on the planet. However, despite the major economic challenges, the British pound sterling has remained relatively stable.
On Europe’s mainland, French economic output is stabilizing as expansion in its dominant services sector has offset weaker activity in construction and manufacturing. The Bank of France reported output is holding steady in July and August at a level of 0.5% above the end of 2021. “In an economic environment that remains difficult with tensions on commodities markets and supply and hiring difficulties, activity continues to resist,” the central bank said. The gauge of the Eurozone’s second-largest economy provides some reassurance before what’s expected to be a difficult end to the year, with households and firms under pressure from high inflation and possible energy shortages.
Germany – the Eurozone’s powerhouse – has now become its weakest link. Germany’s economy stagnated between the first and second quarters, while the Eurozone as a whole grew by 0.7%. Last month the International Monetary Fund slashed its forecast for German growth in 2023 by 1.9%, down to 0.8%–the biggest downgrade of any country. While Italy, Spain and France recorded stronger than expected growth on the back of a tourism-fueled boom in its services economy, Germany has had to rely more on domestic demand. Christian Lindner, Germany’s Finance Minister, stated his country’s prospects had become “fragile”. Soaring inflation, persistent supply chain problems, and weaker global demand are weighing heavily on the country’s large industrial sector.
In Asia, China took action against Taiwan following U.S. House Speaker Nancy Pelosi’s visit to the island earlier this month after ignoring warnings from Beijing. China suspended imports of Taiwan citrus, frozen fish, sweets and biscuits and exports of natural sands to Taiwan. The new measures appear to be more symbolic than real, analysts say, as the new sanctions affect only about 0.04% of their two-way trade. Taiwan’s exports to mainland China were worth $113 billion last year and its imports from China amounted to about $82 billion, the bulk of which was in electrical machinery, electronic and technological parts, none of which Beijing has targeted.
Over 40% of major companies in Japan expect the economy to slow down over the next year, a Kyodo News survey showed. The reading was a huge increase from just 5% recorded one year ago. The survey of 114 companies, including Toyota Motor Corp. and SoftBank Group Corp., found that Japanese blue chips are becoming increasingly pessimistic about the country’s economic outlook. Furthermore, the survey found the number of those that believe the economy will expand dropped to just 55% from 90% last year. Higher commodity prices, a decline in consumer spending, and the yen’s weakness against the U.S. dollar and other major currencies were all cited as reasons for the dour outlook.
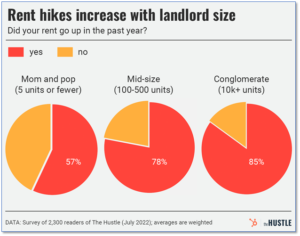
Finally: Over the past year nearly every essential good or service has escalated in price, but for those renting, costs have often skyrocketed. News site “The Hustle” conducted a survey attempting to gain more insight into how much rent has gone up over the past year and why. Their findings: a whopping 71% of renters experienced rent hikes last year with an average increase of 14.6%. In certain hot spots, such as Miami, San Diego, and Austin, average rent was up more than 25%! As for why, the survey found a very interesting relationship: the probability of a rent increase was highly correlated with the size of the landlord. Just 57% of Mom-and-Pop landlords (fewer than 5 rental units) raised rent over the past year. In contrast, over 85% of respondents reported rent hikes if their landlord was a conglomerate (greater than 10,000 units). (Data and chart from thehustle.com.)
(Sources: All index- and returns-data from Yahoo Finance; news from Reuters, Barron’s, Wall St. Journal, Bloomberg.com, ft.com, guggenheimpartners.com, zerohedge.com, ritholtz.com, markit.com, financialpost.com, Eurostat,0020Statistics Canada, Yahoo! Finance, stocksandnews.com, marketwatch.com, wantchinatimes.com, BBC, 361capital.com, pensionpartners.com, cnbc.com, FactSet.) Content provided by WE Sherman and Company. Securities offered through Registered Representatives of Cambridge Investment Research Inc., a broker-dealer, member FINRA/SIPC. Advisory Services offered through Cambridge Investment Research Advisors, a Registered Investment Adviser. Strategic Investment Partners and Cambridge are not affiliated. Indices mentioned are unmanaged and cannot be invested into directly. Past performance is no guarantee of future results.