
8-1-2022 Weekly Market Update
The very Big Picture
The long-term valuation of the market is commonly measured by the Cyclically Adjusted Price to Earnings ratio, or “CAPE”, which smooths-out shorter-term earnings swings in order to get a longer-term assessment of market valuation. A CAPE level of 30 is considered to be the upper end of the normal range, and the level at which further PE-ratio expansion comes to a halt (meaning that further increases in market prices only occur as a general response to earnings increases, instead of rising “just because”). The market is now above that level.
Of course, a “mania” could come along and drive prices higher – much higher, even – and for some years to come. Manias occur when valuation no longer seems to matter, and caution is thrown completely to the wind – as buyers rush in to buy first, and ask questions later. Two manias in the last century – the “Roaring Twenties” of the 1920s, and the “Tech Bubble” of the late 1990s – show that the sky is the limit when common sense is overcome by a blind desire to buy. But, of course, the piper must be paid, and the following decade or two were spent in Secular Bear Markets, giving most or all of the mania-gains back.
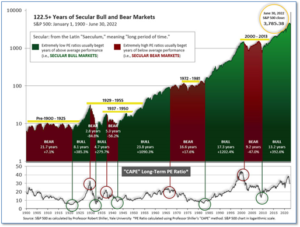
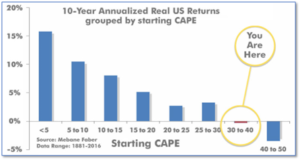
See Fig. 1 for the 100-year view of Secular Bulls and Bears. The CAPE is now at 30.99, up from the prior week’s 29.72. Since 1881, the average annual return for all ten-year periods that began with a CAPE in this range has been slightly positive to slightly negative (see Fig. 2).
Note: We do not use CAPE as an official input into our methods. However, if history is any guide – and history is typically ‘some’ kind of guide – it’s always good to simply know where we are on the historic continuum, where that may lead, and what sort of expectations one may wish to hold in order to craft an investment strategy that works in any market ‘season’ … whether the current one, or one that may be ‘coming soon’!
The Big Picture
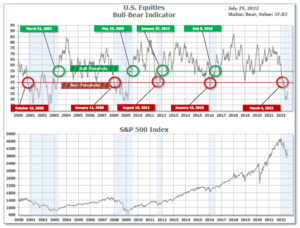
The ‘big picture’ is the (typically) years-long timeframe – the timeframe in which Cyclical Bulls and Bears operate. The U.S. Bull-Bear Indicator finished the week in Bear territory at 37.83, up from the prior week’s 34.61.
In the Quarterly- and Shorter-term Pictures
The Quarterly-Trend Indicator based on the combination of U.S. and International Equities trend-statuses at the start of each quarter – was Negative entering July, indicating negative prospects for equities in the third quarter of 2022.
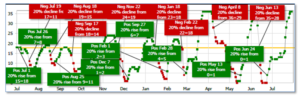
Next, the short-term(weeks to months) Indicator for US Equities turned positive on June 24, and ended the week at 36, up from the prior week’s 31.
In the Markets:
U.S. Markets: U.S. stock benchmarks posted solid gains, despite another hike in interest rates and data showing the economy contracted for a second quarter. A “bad news is good news” dynamic seems to be in play, with investors betting that poor economic news may allow the Federal Reserve to return to a relatively easy monetary policy. The Dow Jones Industrial Average rose 946 points finishing the week at 32,845—a gain of 3.0%. Similarly, the technology-heavy Nasdaq Composite rallied 4.7% closing at 12,391. By market cap, the large cap S&P 500 and small cap Russell 2000 each rose 4.3% while the mid cap S&P 400 gained 4.8%.
International Markets: International markets finished the week mostly to the upside as well. Canada’s TSX rose 3.7% and the United Kingdom’s FTSE 100 added 2%. On Europe’s mainland, France’s CAC 40 and Germany’s DAX rose 3.7% and 1.7%, respectively. In Asia, China’s Shanghai Composite pulled back -0.5% and Japan retreated -0.4%. As grouped by Morgan Stanley Capital International, developed markets rose 3.7% while emerging markets added 1.4%.
Commodities: Equities weren’t alone in rallying this week as commodities joined the parade. Precious metals rose with Gold gaining 3.2% to $1781.80 per ounce, while Silver surged 8.5% to $20.20. Energy also rallied. West Texas Intermediate crude oil climbed 4.1% to $98.62. Brent crude gained 6.2% to $110.01. The industrial metal copper, viewed by some analysts as a barometer of world economic health due to its wide variety of uses, finished the week up a sizable 6.7%.
July Summary: For the month of July, the Dow gained 6.7%, the Nasdaq surged 12.3%, and the S&P 500 added 9.1%. The mid cap S&P 400 and small cap Russell 2000 added 10.7% and 10.4%, respectively, adding up to the best month of the year for the U.S. market. Canada and the UK finished up 4.4% and 3.5%, respectively, while France rose 8.9% and Germany added 5.5%. China was the lone major market to finish the month down, giving up -4.3%. As grouped by Morgan Stanley Capital International, developed markets surged 5.2% but emerging markets ended the month down ‑0.3%. Gold and Silver gave up -1.4% and -0.8% in July, respectively. West Texas Intermediate declined -6.8%, while Brent crude finished up 0.7%. Copper finished the month down -3.7%.
U.S. Economic News: The number of Americans filing for initial unemployment benefits slowed last week after hitting an eight-month high, according to the Labor Department. Initial claims fell by 5,000 to 256,000, missing expectations of a fall to 249,000. The four-week average of claims, smoothed to iron out the weekly volatility, rose by 6,250 to 249,250. Jobless claims have been ticking higher since hitting a low of 166,000 in March. Still, readings under 300,000 are still considered a robust labor market. Meanwhile, the number of people already collecting benefits fell by 25,000 to 1.36 million.
Home prices pulled back in May from their record high set in April, according to the latest report from S&P Case-Shiller. The Case-Shiller 20-city home price index retreated to a 20.5% annual gain in May, down from 21.2% the previous month. S&P said that the year-over-year growth in May was the second highest for the 20-city index. April’s gain was the peak. Tampa, Miami, and Dallas led the cities with the highest annual gains. Minneapolis, Chicago, and Washington D.C. were the lowest. Regionally, the South and Southeast experienced the strongest price growth at 30.7%. Lou Crandall, chief economist at Wrightson ICAP, claimed that the decline in housing affordability to its lowest level in 15 years, would start to “restrain house price acceleration”. The cost of borrowing has increased dramatically since last year, with the average on the 30-year fixed-rate at 5.54%, according to Freddie Mac. Last year around the same time, that rate was at 2.78%.
Pending home sales, transactions in which a deal has been signed but not yet closed, fell by -8.6% in June, according to the National Association of Realtors (NAR). The result was a significant miss. Analysts had forecast pending home sales to drop by just 1%. The drop in pending home sales is the biggest since the depths of the pandemic in April and March 2020. Compared with a year earlier, transactions were down 20%. Furthermore, new home sales, builder confidence, and declining mortgage application volume, are waning simultaneously. Lawrence Yun, NAR Chief Economist, stated “Home sales will be down by 13% in 2022, according to our latest projection.” He added that buying a home in June of 2022 was 80% more expensive than in 2019.
The Federal Reserve hiked interest rates again this week as it strives to reign in rampant inflation. The Fed lifted its key rate by 0.75 percentage point to 2.5%, a move that was widely expected. The increase was its fourth this year in its aggressive bid to cool the hottest inflation in four decades. Furthermore, the Fed signaled more rate hikes are coming even as the economy shows clear signs of slowing. “Ongoing increases” in interest rates “will be appropriate,” the Fed said. Chief economist Avery Shenfeld of CIBC World Markets stated, “While there are looming concerns over growth, the Fed has decided that in the battle against inflation, it will shoot first and ask questions later.” The level of rates right now matches what the Fed considers neutral–neither boosting nor slowing the economy. Powell was noncommittal about future rate increases. Rates would go higher, he said, but the Fed would make that decision based on the incoming economic data.
The U.S. economy shrank at an annual 0.9% pace in the second quarter, marking its second quarterly decline in a row. The reading was a wide miss from consensus forecasts. Economists had expected a 0.3% increase. The back-to-back declines in GDP were the first since the 2007-2009 Great Recession. A drop in business investment and smaller increase in inventories largely accounted for the negative GDP print in the second quarter. However, consumer spending – the main engine of the U.S. economy – rose at a 1% annual rate. While two consecutive quarters of declining GDP has been commonly viewed as the official definition of a recession, a group of prominent economists responsible for declaring official recessions announced that the old rule of thumb does not always apply. Regardless, as chief economist Richard Moody at Regions Financial states, “The economy has clearly slowed.”
Inflation surged again last month, remaining at a 40-year high, a key price gauge showed. The Personal Consumption Expenditures (PCE) Index, rumored to be the Fed’s preferred measure of inflation, rose a sharp 1% in June, led by higher fuel prices. The increase exceeded forecasts of a 0.9% advance. A narrower measure of inflation that omits food and energy costs, “core PCE”, rose by 0.6%. That was also above estimates. The rate of inflation of the PCE over the past year climbed to 6.8% from 6.3% in the prior month–the highest rate since January 1982. Unlike the more publicized Consumer Price Index, the PCE gauge takes into account how consumers change their behavior in response to higher prices. They might substitute cheaper goods such as ground beef for more expensive ones like ribeye to keep their costs down, for example.
Consumer spending, which makes up around 70% of the U.S. economy, jumped 1% in June, but the big increase was largely due to higher prices rather than true growth. After adjusting for inflation, spending rose by just 0.1%. In essence, consumers paid higher prices instead of buying more goods and services. Incomes also rose 0.6% in the month however, not enough to keep up with inflation. Households are continuing to fall behind financially. The savings rate fell to a 13-year low of 5.1% in June from 5.5%.
Confidence among the nation’s consumers declined for a third consecutive month in July, the Conference Board reported. The board’s Consumer Confidence Index fell 2.7 points to 95.7 in July—worse than expected. Economists had expected a declined to just 97. The sub-index that tracks how consumers feel about current economic conditions fell to 141.3 this month, down from 147.2 in June. And the gauge that assesses what Americans expect over the next six months ticked down to 65.3 from 65.8. Rising inflation and forecasts of an imminent recession have weighed on consumers. Lynn Franco, the senior director of economic indicators at the Conference Board, stated “Looking ahead, inflation and additional rate hikes are likely to continue posing strong headwinds for consumer spending and economic growth over the next six months.”
Orders for goods expected to last at least three years, so-called ‘durable goods’, increased 1.9% last month, but beneath the headline number the report wasn’t as optimistic. Orders for new cars and trucks rose 1.5% in June, while orders for fighter jets and military planes jumped 81%, lifting the overall number. New orders outside the transportation segment rose a smaller 0.3%. The increase in so-called core orders, a measure of business investment, was 0.5% for the second month in a row. Business investment has climbed 8.4% over the past year; however the rate of growth has slowed steadily since hitting a pandemic high of 22% in April 2021. Senior U.S. economist Andrew Hunter wrote in a note to clients that the details of the report are “consistent with a sharp slowdown in private equipment investment growth in the second quarter.”
International Economic News: Preliminary estimates from Statistics Canada showed Canada’s economy was flat in May – a sign a slowdown in already underway. The data agency said that a slight uptick in the service sector wasn’t enough to offset a decline in goods-producing industries, so the total value of all economic output during the month was essentially unchanged from what it was a month earlier. Despite the flat showing, it exceeded the slight decrease of ‑0.2% that economists had been expecting. The GDP numbers come against the backdrop of stubbornly high inflation, which has risen to its highest level in decades. Given the data, economists see little reason for Canada’s central bank to deviate from its campaign of interest rate hikes. Economist Royce Mendes with Desjardins stated, “We continue to see the central bank raising rates by 50 basis points in September.”
Across the Atlantic, British consumer spending on “unnecessary” items, such as clothing, furniture, and vehicles, fell to its lowest since February last week. According to the Office for National Statistics, spending on goods categorized as “delayable” fell to 80% of its pre-pandemic February 2020 average level. Due to inflation and the immense cost of fueling cars for commuting, consumer spending has skewed towards work-related spending. Chancellor Nadhim Zahawi stated, “I know people are concerned, so we are continuing to support families and economic growth. We’re working alongside the Bank of England to bear down on inflation, and I am confident we can create a stronger economy for everyone across the UK.” With inflation already at 9.1%, economists are concerned consumer spending will plummet, prompting a recession.
INSEE, France’s statistics agency, reported its economy showed 0.5% second-quarter growth, following a -0.2% pullback recorded in the first quarter. French Finance Minister Bruno Le Maire hailed the country’s second quarter economic growth as a “victory”, even as analysts said fears about a recession in Europe were growing due to rising inflation. The French economy got a boost from exports, added INSEE, although analysts said near-term pressures remained in terms of inflation.
Germany’s economy stagnated in the second quarter remaining unchanged from the previous quarter in adjusted terms, according to its Federal Statistics Office (FSO). Germany’s economy surpassed the FSO’s expectations in the first quarter, revising the quarter’s growth to 0.8% from 0.2%. In the second quarter, household and government consumption helped support the economy, but the pandemic, war in Ukraine, and interruptions in supply chains weighed. With uncertainty about energy supply and grim economic sentiment, analysts state Germany appears on the brink of an economic decline. Alexander Krueger of Hauck Aufhaeuser Lampe private bank stated, “As of today, it would already be a success if economic output in the second half of the year continued to stagnate.”
In Asia, state media said China will “try hard to achieve the best possible result” for the economy this year, a deviation from previous calls for a specific growth target. In the second half, China should “stabilize employment and prices, maintain economic operations within a reasonable range, and strive to achieve the best possible results,” Xinhua news agency reported. The world’s second-largest economy narrowly avoided contracting in the second quarter due to widespread COVID-19 lockdowns. Analysts said Beijing’s full-year growth target of around 5.5% had been looking increasingly unattainable. First-half gross domestic product grew only 2.5% from a year earlier. China last missed its growth target in 2015.
Japan’s government slashed its economic growth forecast for this fiscal year largely due to slowing overseas demand. The world’s third-biggest economy is now expected to expand about 2.0% in price-adjusted real terms in the fiscal year ending in March 2023, according to Japan’s Cabinet Office. That marked a sharp downgrade from the government’s previous forecast of 3.2% growth released in January. The cut largely stemmed from weaker exports, which the government expects to expand 2.5% compared to 5.5% in the previous assessment.
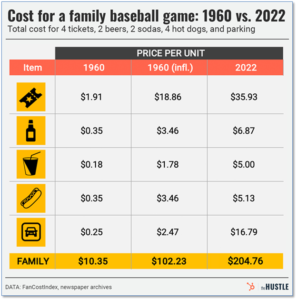
Finally: In the dog days of summer a common American pastime has traditionally been attending a Major League Baseball game. However, many middle-class families are finding that spending a few hours cheering on the home team is increasingly financially out-of-reach. For example, a typical family outing to the most expensive venue – the Boston Red Sox’ Fenway Park – might buy 4 tickets ($61.71 each), 4 hot dogs ($6 each), 2 beers ($9.50 each), and 2 sodas ($5.50 each), plus parking ($23.53), which comes in at a whopping $324.37. The average cost across all major league stadiums is $204.76. In the days of Willie Mays, Hank Aaron, and Sandy Koufax, the cost of the average family baseball game was half of what it is today—even after taking into account inflation – and just $10.35 in 1960 dollars. (Chart from thehustle.co)
(Sources: All index- and returns-data from Yahoo Finance; news from Reuters, Barron’s, Wall St. Journal, Bloomberg.com, ft.com, guggenheimpartners.com, zerohedge.com, ritholtz.com, markit.com, financialpost.com, Eurostat,0020Statistics Canada, Yahoo! Finance, stocksandnews.com, marketwatch.com, wantchinatimes.com, BBC, 361capital.com, pensionpartners.com, cnbc.com, FactSet.) Content provided by WE Sherman and Company. Securities offered through Registered Representatives of Cambridge Investment Research Inc., a broker-dealer, member FINRA/SIPC. Advisory Services offered through Cambridge Investment Research Advisors, a Registered Investment Adviser. Strategic Investment Partners and Cambridge are not affiliated. Indices mentioned are unmanaged and cannot be invested into directly. Past performance is no guarantee of future results.