
8-7-2023 Weekly Market Update
The very Big Picture
The long-term valuation of the market is commonly measured by the Cyclically Adjusted Price to Earnings ratio, or “CAPE”, which smooths-out shorter-term earnings swings in order to get a longer-term assessment of market valuation. A CAPE level of 30 is considered to be the upper end of the normal range, and the level at which further PE-ratio expansion comes to a halt (meaning that further increases in market prices only occur as a general response to earnings increases, instead of rising “just because”). The market was recently above that level and has fallen back.
Of course, a “mania” could come along and drive prices higher – much higher, even – and for some years to come. Manias occur when valuation no longer seems to matter, and caution is thrown completely to the wind – as buyers rush in to buy first, and ask questions later. Two manias in the last century – the “Roaring Twenties” of the 1920s, and the “Tech Bubble” of the late 1990s – show that the sky is the limit when common sense is overcome by a blind desire to buy. But, of course, the piper must be paid, and the following decade or two were spent in Secular Bear Markets, giving most or all of the mania-gains back.
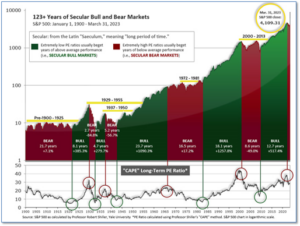
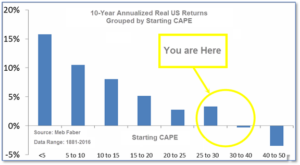
See Fig. 1 for the 100-year view of Secular Bulls and Bears. The CAPE is now at 30.98, down from the prior week’s 31.94. Since 1881, the average annual return for all ten-year periods that began with a CAPE in this range has been slightly positive to slightly negative (see Fig. 2).
Note: We do not use CAPE as an official input into our methods. However, if history is any guide – and history is typically ‘some’ kind of guide – it’s always good to simply know where we are on the historic continuum, where that may lead, and what sort of expectations one may wish to hold in order to craft an investment strategy that works in any market ‘season’ … whether the current one, or one that may be ‘coming soon’!
The Big Picture
The ‘big picture’ is the (typically) years-long timeframe – the timeframe in which Cyclical Bulls and Bears operate. The U.S. Bull-Bear Indicator finished the week in Bull territory at 68.89, down from the prior week’s 70.96. (see Fig. 3)

In the Quarterly- and Shorter-term Pictures
The Quarterly-Trend Indicator based on the combination of U.S. and International Equities trend-statuses at the start of each quarter – was Positive entering July, indicating positive prospects for equities in the third quarter.
Next, the short-term(weeks to months) Indicator for US Equities turned positive on May 25, and ended the week at 28, down from the prior week’s 31.

In the Markets:
U.S. Markets: The major U.S. equity benchmarks started the month in the red after closing out a strong July. Stocks declined amid rising Treasury yields and an unexpected downgrade to the U.S. government’s credit rating by ratings agency Fitch. The technology-heavy NASDAQ Composite led the way pulling back -2.8% to 13,909. The narrowly-focused Dow Jones Industrial Average shed 394 points finishing the week at 35,066, a decline of -1.1%. By market cap, the large cap S&P 500 retreated -2.3%, while the mid cap S&P 400 pulled back -1.3%. The small cap Russell 2000 ended the week down -1.2%. Markets rose a second consecutive month in July. The Dow and Nasdaq added 3.3% and 4%, while the S&P 500 gained 3.1%. Mid caps rose 4% in July, small caps surged 6.1% for the month.
International Markets: The majority of major international indexes finished the week in the red as well. Canada’s TSX closed down -1.4% and the United Kingdom’s FTSE 100 declined -1.7%. France and Germany fell -2.2% and -3.1% respectively, while China’s Shanghai Composite ticked up 0.4%. Japan’s Nikkei ended the week down -1.7%. As grouped by Morgan Stanley Capital International, developed markets pulled back -3.1%. Emerging markets ended the week down -3.3%. July was a good month for international markets, Canada and the UK rose 2.3% and 2.2%, while France and Germany gained 1.3% and 1.9% respectively. China rose 2.8% while Japan’s Nikkei ticked down -0.1%. Developed markets rose 2.7% while emerging markets surged 6%.
Commodities: Precious metals ended the week down as well. Gold fell -1.2% to $1976.10 per ounce, while Silver declined -3.2% to $23.72. The industrial metal copper, viewed by some analysts as a barometer of world economic health due to its wide variety of uses, ended the week down -1.5%. West Texas Intermediate crude oil finished the week to the upside adding 2.8% to $82.82 per barrel. In July, Gold rose 4.1% while Silver surged 8.5%. Copper added 6.6% in the month while oil jumped 15.8%.
U.S. Economic News: The number of workers filing first-time unemployment benefits rose slightly but remained near historically low levels. The Labor Department reported initial jobless claims rose to 227,000 last week. Initial claims have trended down in recent weeks after rising earlier this year when companies in industries such as technology, finance and real estate cut jobs. Meanwhile, continuing claims, which counts the number of people already receiving benefits, increased to 1.7 million people. That number is reported with a one-week lag.
The number of job openings in the U.S. dipped to 9.6 million in June, but the demand for workers is still quite strong and suggests there’s little slack in the labor market. Job listings fell slightly to 9.58 million from 9.62 million in May, the Labor Department reported. Job openings in June are still somewhat high, but down from the peak of 12 million last year. The number of job openings can signal the strength of the labor market and provide insight for the broader economy. Meanwhile, the number of people who quit their jobs fell to 3.8 million in June down from 4 million in May. People quit more often when they think they can easily find another job, and they’re less likely to quit when the economy weakens. “This is a small step in the right direction in terms of signals that the labor market may be coming into better balance,” said Katherine Judge, senior economist at CIBC Economics.
The U.S. added a more lukewarm 187,000 new jobs last month, perhaps a sign the economy is cooling off enough to drive inflation lower and even stave off increases in interest rates. Employment growth has come in less than 200,000 for a second consecutive month—the first time since the onset of the pandemic. The increase in hiring in July was concentrated in just a handful of areas, mostly health care and social assistance. Roughly 87,000 jobs–or 47% of July’s total–were created by medical providers and social programs. Hiring also rose slightly in leisure and hospitality, finance, wholesale and government. Chief economist Gus Faucher of PNC Financial Services noted, “Today’s July jobs report is consistent with a soft landing in the U.S. economy. Job growth is gradually slowing to a more sustainable pace.”
The vast services side of the U.S. economy (roughly 70% of GDP) slowed slightly but remained in expansion last month. The service-sector fell to 52.7 from 53.9, a larger drop than the 53.3 economists had expected. The index has remained in expansionary territory (above 50) for seven months in a row. In the report, the index of new orders dipped 0.5 to 55, while the production gauge fell 2.1 points to 57.1. The employment barometer dropped 2.4 points to 50.7. Demand for services has been strong in the aftermath of the pandemic. People’s desire to travel and go to restaurants has been a balancing force while the industrial side of the economy has remained relatively weak. Following the report, Andrew Hunter, deputy chief U.S. economist at Capital Economics stated, “Even though the risks of a recession may be easing, that doesn’t mean the economy is set to enjoy a strong performance over the second half of the year.”
Manufacturing activity rose slightly last month but remained at depressed levels suggesting little improvement in the industrial side of the U.S. economy. The Institute for Supply Management reporting its manufacturing index edged up to 46.4% from 46% in the prior month. Economists had been expecting a reading of 46.8%. The June reading was the lowest since the onset of the pandemic in 2020. Numbers below 50% signal contraction. In the details, new orders edged up 1.7% to 47.3%, while the production barometer rose 1.6 points to 48.3. The employment gauge dropped 3.7 points to 44.4—the lowest level since July of 2020. The index has been negative for nine months in a row—a streak not seen since the 2007-2009 Great Recession.
International Economic News: Canada’s unemployment rate rose for a third-straight month in July as its economy shed 6,400 jobs, a softening which economists say could impact the Bank of Canada’s next interest rate decision. Statistics Canada reported that in July, the unemployment rate increased 0.1 percentage points to 5.5%. July marks the first time the unemployment rate has increased for three consecutive months since the early months of the COVID-19 pandemic. “The soft July employment report is just the latest arrow in the quiver of signs that the economy is losing momentum,” Doug Porter, chief economist and managing director of economics at BMO, said in a note. Statistics Canada said job losses were led by the construction industry, while the greatest job gains were made in health care and social assistance.
The Bank of England raised its main interest rate a quarter-percentage point to a new 15-year high and indicated that it would remain elevated to deter high inflation. For Brits watching their rents and mortgages rising in the midst of a cost-of-living crisis, adding higher interest rates provides little solace. Figures last month showed that inflation fell to 7.9%, which was more than anticipated. This eased the pressure for the central bank to act more aggressively. The anticipated hike to 5.25% marked the central bank’s 14th consecutive hike. The bank said risks from stubborn inflation, including higher wages, have “begun to crystallize,” causing it to push borrowing costs even higher. The central bank noted in recent forecasts that inflation is expected to drop to 4.9% by the final quarter, with food prices set to moderate. Bank Governor Andrew Bailey said, “Inflation is falling, and that’s good news. We know that inflation hits the least well-off the hardest, and we need to make absolutely sure that it falls all the way back to the 2% target.”
Amid tension over Beijing’s surging trade surpluses, France’s Finance Minister Bruno Le Maire pressed Chinese leaders to open their markets wider to foreign companies. At the 9th China-France High Level Economic and Financial Dialogue held in Beijing, Le Maire lobbied for investment in France’s electric car industry and insisted China extend their markets to foreign companies. Le Maire and Chinese Vice Premier He Lifeng, Beijing’s top envoy on economic issues, along with Treasury Secretary Janet Yellen, met to revive frigid relations with China. Chinese officials welcomed Le Maire and Yellen and seemed open to revive foreign investor interest. Beijing has given no indication of altering technology policies, which its trading partners say violate Chinese market-opening commitments.
The country that was informally known as the EU’s “industrial powerhouse” is failing to grow. In its latest forecast, the International Monetary Fund said Germany would be the only G7 economy to shrink this year as weak economic growth plagues major economies globally amid rising interest rates and growing inflation. High energy prices, elevated borrowing costs, and a tepid rebound in trade with China have all weighed on Germany’s economy. Economic output stagnated in the second quarter of this year, according to the Federal Statistics Office. The first quarter saw a 0.1% decline, while the last months of 2022 saw a drop of 0.4% during the energy shock from Russia’s war in Ukraine. One of Germany’s main challenges was its dependence upon Russian natural gas to fuel its industry, which dried up after the EU declared sanctions against Moscow. Higher costs for energy-intensive industries, including metals, glass, cars and fertilizer, have been challenging for Germany as well.
China is attempting to boost its consumer spending as its factory sector contracted for a fourth consecutive month. According to the National Bureau of Statistics, the official manufacturing Purchasing Managers’ Index (PMI) came in at 49.3 in July up 0.3 from June. The official non-manufacturing PMI, which evaluates activities in services and construction, fell to 51.5—marking its lowest rate since February 2020. In response, the National Development and Reform Commission (NDRC) released a policy document listing 20 measures to restore and expand consumption. The policy covers a range of industries, including real estate, electronic products, and automobiles. To encourage consumer spending, consumer loans will be increased to boost car purchases, more EV charging facilities will be constructed, and local governments will hold food, music, and sports festivals to attract tourists. “Boosting consumption is the key in stimulating recovery and expanding demand,” said Li Chunlin, deputy director of the National Development and Reform Commission (NDRC) and China’s top economic planner.
Japan’s central bank held its benchmark interest rate unchanged at -0.1% but adjusted its bond purchasing to allow greater flexibility given the “high uncertainties” facing the world’s third-largest economy. The Bank of Japan said it needed a nimbler approach to keep financial markets stable as it works toward a goal of keeping inflation near 2%, the level it says is needed for sustained economic growth. The bank’s governor, Kazuo Ueda, said the move was a not a step toward giving up its ultra-lax monetary policy. The aim of the Bank of Japan’s ultra-lax monetary policy is still to keep long-term interest rates near zero. For the past decade, it has also used massive asset purchases to keep credit cheap to try to spur investment and spending and prop up economic growth.
Finally: International Friendship Day was celebrated on July 30th. Statista’s Anna Fleck examined data from its Consumer Insights survey to see where ‘socializing’ was counted most often as a hobby in different countries of the world. As the following graphic shows, Germans and to a slightly lesser extent the Danish and Spanish, are particularly likely to include spending time with others as one of their main personal pastimes. In contrast, respondents in the United States and in urban India were far less likely to consider socializing as one of their top hobbies, with only around one in four picking the option. In the U.S., cooking and baking, reading, spending time with pets, and video gaming far outperformed socializing as favored activities.

(Sources: All index- and returns-data from Norgate Data and Commodity Systems Incorporated; news from Reuters, Barron’s, Wall St. Journal, Bloomberg.com, ft.com, guggenheimpartners.com, zerohedge.com, ritholtz.com, markit.com, financialpost.com, Eurostat, Statistics Canada, Yahoo! Finance, stocksandnews.com, marketwatch.com, wantchinatimes.com, BBC, 361capital.com, pensionpartners.com, cnbc.com, FactSet.) Content provided by WE Sherman and Company. Securities offered through Registered Representatives of Cambridge Investment Research Inc., a broker-dealer, member FINRA/SIPC. Advisory Services offered through Cambridge Investment Research Advisors, a Registered Investment Adviser. Strategic Investment Partners and Cambridge are not affiliated. Indices mentioned are unmanaged and cannot be invested into directly. Past performance is no guarantee of future results. These opinions of Strategic Investment Partners and not necessarily those of Cambridge Investment Research, are for informational purposes only and should not be construed or acted upon as individualized investment advice.