
7-31-2023 Weekly Market Update
The very Big Picture
The long-term valuation of the market is commonly measured by the Cyclically Adjusted Price to Earnings ratio, or “CAPE”, which smooths-out shorter-term earnings swings in order to get a longer-term assessment of market valuation. A CAPE level of 30 is considered to be the upper end of the normal range, and the level at which further PE-ratio expansion comes to a halt (meaning that further increases in market prices only occur as a general response to earnings increases, instead of rising “just because”). The market was recently above that level and has fallen back.
Of course, a “mania” could come along and drive prices higher – much higher, even – and for some years to come. Manias occur when valuation no longer seems to matter, and caution is thrown completely to the wind – as buyers rush in to buy first, and ask questions later. Two manias in the last century – the “Roaring Twenties” of the 1920s, and the “Tech Bubble” of the late 1990s – show that the sky is the limit when common sense is overcome by a blind desire to buy. But, of course, the piper must be paid, and the following decade or two were spent in Secular Bear Markets, giving most or all of the mania-gains back.
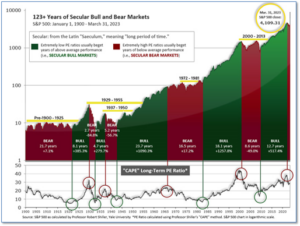
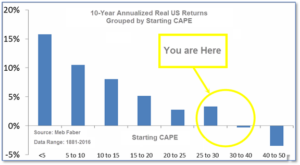
See Fig. 1 for the 100-year view of Secular Bulls and Bears. The CAPE is now at 31.94, up from the prior week’s 31.62. Since 1881, the average annual return for all ten-year periods that began with a CAPE in this range has been slightly positive to slightly negative (see Fig. 2).
Note: We do not use CAPE as an official input into our methods. However, if history is any guide – and history is typically ‘some’ kind of guide – it’s always good to simply know where we are on the historic continuum, where that may lead, and what sort of expectations one may wish to hold in order to craft an investment strategy that works in any market ‘season’ … whether the current one, or one that may be ‘coming soon’!
The Big Picture:
The ‘big picture’ is the (typically) years-long timeframe – the timeframe in which Cyclical Bulls and Bears operate. The U.S. Bull-Bear Indicator finished the week in Bull territory at 70.96, up from the prior week’s 69.18. (see Fig. 3)

In the Quarterly- and Shorter-term Pictures
The Quarterly-Trend Indicator based on the combination of U.S. and International Equities trend-statuses at the start of each quarter – was Positive entering July, indicating positive prospects for equities in the third quarter.
Next, the short-term(weeks to months) Indicator for US Equities turned positive on May 25, and ended the week at 31, up from the prior week’s 30.

In the Markets:
U.S. Markets: Stocks ended the week higher notable for the Dow Jones Industrial Average’s notching its 13th consecutive daily gain on Wednesday, which marked its longest winning streak since 1987. The NASDAQ led the way, rising 2% to 14,317, while the Dow Jones Industrial Average added 0.7% to 35,459. By market cap, the large cap S&P 500 rose 1%, the S&P 400 mid cap tacked on 0.4%, and the small cap Russell 2000 finished the week up 1.1%.
International Markets: The majority of large international markets finished in the green as well. Canada’s TSX ticked down -0.1%, but the UK’s FTSE 100 rose 0.4% and France’s CAC and Germany’s DAX gained 0.6% and 1.8% respectively. In Asia, China’s Shanghai Composite jumped 3.4%, while Japan’s Nikkei added 1.4%. As grouped by Morgan Stanley Capital International, developed markets added 0.6% while emerging markets surged 4%.
Commodities: Precious metals finished the week to the upside. Gold closed up 2.8% to $1999.90 per ounce, while Silver rose 0.5% to $24.50. West Texas Intermediate crude oil rose for a fifth consecutive week adding 0.6% closing at $50.58 per barrel. The industrial metal copper, viewed by some analysts as a barometer of world economic health due to its wide variety of uses, ended the week up 1.3%.
U.S. Economic News: Despite the Federal Reserve’s efforts to slow demand, the labor market remains persistently tight. The Labor Department reported the second consecutive weekly decline in claims. Initial claims for state unemployment benefits fell by 9,000 to a seasonally adjusted 228,000. Bill Adams, chief economist at Comerica Bank in Dallas wrote, “Many employers are reluctant to reduce headcount despite a slower economy, since the labor market is very tight, which might make rehiring difficult if growth picks up in six or twelve months.” Meanwhile, continuing claims, which counts the number of people already receiving benefits increased by 33,000 to 1.754 million in July. Overall, claims remain significantly below the 280,000-level that economists use to determine deterioration in job growth.
S&P Case-Shiller reported that home prices continued to climb with significant differences by region. Prices nationally increased 0.7% on the month, while the 20-city composite gained 1%. Out of the 20-city composite, 10 cities saw higher prices and the other half saw lower prices on an annual basis. Prices in Chicago gained 4.6%, 3.9% in Cleveland, and 3.5% in New York–marking the top performers. The Midwest surpassed the South as the strongest region. Cities in the West, where prices had inflated most drastically, were the worst performers in the second quarter. The lowest performers were Seattle, down 11.3%, and San Francisco, which fell 11%. As low supply persists, prices continue to rise. Current homeowners are reluctant to sell, while the mortgage rates they’re paying remain below half of today’s rates. According to Craig Lazzara, managing director at the S&P DJI, “Home prices in the U.S. began to fall after June 2022, and May’s data bolster the case that the final month of the decline was January 2023.” He added, “Granted, the last four months’ price gains could be truncated by increases in mortgage rates or by general economic weakness. But the breadth and strength of May’s report are consistent with an optimistic view of future months.”
The U.S. economy showed few signs of recession in the second quarter as gross domestic product grew at a faster-than-expected pace during the period, the Commerce Department reported. GDP, the sum of all goods and services activity, increased at a 2.4% annualized rate for the April-through-June period, better than the 2% consensus estimate from Dow Jones. Consumer spending powered the solid quarter, aided by increases in nonresidential fixed investment, government spending and inventory growth. Perhaps as important, inflation was held in check through the period. The personal consumption expenditures price index increased 2.6%, down from a 4.1% rise in the first quarter and well below the Dow Jones estimate for a gain of 3.2%. Steve Rick, chief economist at TruStage wrote, “It’s great to have another quarter of positive GDP growth in tandem with a consistently slowing inflation rate. After yesterday’s resumption of interest rate hikes, it’s encouraging to see the aggressive hike cycle working as inflation continues to decline. Consumers are getting a reprieve from the rising costs of core goods, and the U.S. economy is off to a stronger start to the first half of the year.”
This week the Federal Reserve approved a “well-telegraphed” interest rate hike, which brings the benchmark borrowing costs to their highest point in over 22 years. Policymakers had indicated at June’s meeting that two rate rises were coming this year. The central bank’s Federal Open Market Committee increased its funds rate by a quarter percentage point to a target range of 5.25%-5.5%. The midpoint of that target range would be the highest level for the benchmark rate since early 2001. Chairman Jerome Powell said inflation has moderated since mid of last year but procuring the Fed’s 2% target “has a long way to go.” Their next meeting will be in September. “I would say it’s certainly possible that we would raise funds again at the September meeting if the data warranted,” said Powell. “And I would also say it’s possible that we would choose to hold steady and we’re going to be making careful assessments, as I said, meeting by meeting.” Joe Brusuelas, U.S. chief economist at RSM stated, “It is time for the Fed to give the economy time to absorb the impact of past rate hikes. With the Fed’s latest rate increase of 25 basis points now in the books, we think that improvement in the underlying pace of inflation, cooler job creation and modest growth are creating the conditions where the Fed can effectively end its rate hike campaign.”
Business activity grew at a weaker pace in July according to a pair of preliminary surveys from S&P Global. The S&P Global Flash Composite Output Index, which gauges activity in the manufacturing and services sectors, fell from 53.2 to 52.0 this month. This drop marks the lowest rate of expansion in five months. The flash U.S. services PMI slowed to 52.4 in July from June’s 54.4, disappointing economists’ forecast of 54.0. According to S&P Global, export orders reinforced the reading, but domestic demand was deterred by higher interest rates. The flash U.S. manufacturing PMI rallied from June’s 46.3 to 49.0 in July. This exceeds economists’ expectations of 46.7. “Growth is being entirely driven by the service sector, and in particular rising spending from international clients, which is helping offset a becalmed manufacturing sector and increasingly subdued demand from U.S. households and businesses,” said Chris Williamson, S&P Global’s chief business economist. “July is seeing an unwelcome combination of slower economic growth, weaker job creation, gloomier business confidence and sticky inflation,” Williamson added.
International Economic News: Economists say Canada’s immigration paints a “mirage of economic prosperity”. David Rosenberg, chief economist and strategist at Rosenberg Research, said that through population growth “you can create this mirage of economic prosperity, but in the end that’s what it is, a mirage.” Canadian Prime Minister Justin Trudeau has ramped up immigration to galvanize economic growth and fill gaps in the labor market. Since 2015, Trudeau brought in approximately 2.5 million new permanent residents, lifting the population to over 40 million. According to Statistics Canada, the new arrivals are adding strain to public services and an overheating economy. Marc Ercolao, an economist at TD Economics, says that it is primarily thanks to immigration that Canada matched an average GDP growth of 2% over the last decade, just above the G7 average of 1.4%. Bank of Canada Governor Tiff Macklem said immigration contributes to both supply and demand, but the effect has heightened the need for higher interest rates. Immigrants eased a labor shortage and added to consumer spending and housing demand. “If you start an economy with excess demand and you add both demand and supply, you are still in excess demand,” Macklem said after hiking rates to 5.0% earlier this month.
After months of dire economic predictions during “Brexit” the International Monetary Fund was forced to admit Britain will outperform EU’s powerhouse Germany this year. The IMF forecasts that the UK’s economy will grow 0.4% this year, in contrast with April’s pessimistic expectations. A survey conducted by the Confederation of British Industry showed that confidence among businesses has strengthened for the first time in two years. Furthermore, PwC said British consumers were the most optimistic in 18 months. According to the IMF, stronger household consumption and business investment in the UK arose from, “falling energy prices, lower post-Brexit uncertainty, and a resilient financial sector as the March global banking stress dissipates.”
France intends to slow tax cuts as the government tries to reduce its budget deficit. French Finance Minister Bruno Le Maire said that the government decided on a slower tax-lowering path that will be finalized by the end of Macron’s second five-year term in 2027. President Emmanuel Macron has pledged to sever a further €2 billion in taxes on households. He had planned to complete the second half of an €8 billion reduction in a levy on industrial production, known as CVAE, next year. “We want to begin a new reduction in a gradual way to take into account the situation of public finances,” Le Maire stated. After an era of massive spending, through covid and an energy crisis, the government is attempting to shift towards tighter budgets as it waters down its tax cut promises. The Finance Ministry plans to reel in electricity prices and reduce the central state’s spending by €4.2 billion next year. Le Maire said the government will take back half of the €2.5 billion of excess cash holdings at state operators. “Everyone listening knows that heavy debt is unbearable and a danger for the French nation,” Le Maire said.
Manufacturing, the backbone of Germany’s robust growth, has become brittle according to the latest Purchasing Managers’ Index. The Munich-based Ifo institute released its survey showing deterioration, both in the current situation and in businesses’ prospects. The carmakers who drove Germany’s renowned export performance over the last few decades, have been failing to adapt to the market for electric vehicles. Germany’s manufacturers have been under pressure from a drop in demand from China and the energy crunch over the past year. Ifo President Clemens Fuest said the economy probably shrank in the prior three months, extending the first quarter’s drop. “It looks like the German economy is really having a hard time getting out of this recession,” Fuest stated.
China’s top leaders pledged to “adjust and optimize its property policies in a timely manner” regarding its struggling property sector. After the government restricted debt levels in 2020, the country’s property sector has struggled to emerge from a credit crisis. As developers sought to capitalize on property investments and home ownership, supply outstripped demand, and ghost towns were constructed. The Communist Party’s top decision-making body, chaired by President Xi Jinping, said it would implement a pro-active fiscal policy at July’s Politburo meeting, which sets the stage for China’s economic policies for the last two quarters of the year. As the world’s second-largest economy experiences faltering growth, the Politburo emphasized the necessity for adapting to major changes in the demand-supply dynamics in the property market. This adaptation includes city-specific measures to ensure residents’ essential housing demand and their needs for better housing are met.
The IMF’s chief economist urged the BOJ to prioritize future monetary tightening and move away from its yield-curve-control (YCC) policy. Pierre-Olivier Gourinchas, chief economist at the International Monetary Fund, explained that the IMF’s intention was to encourage the Bank of Japan to move away from the controversial yield curve control policy it is currently implementing. As inflation has now surpassed the BOJ’s target, the BOJ has not reached a consensus on how soon it should start phasing out stimulus. Governor Kazuo Ueda has stressed the need to keep its ultra-loose monetary policy until there is more evidence inflation will be sustainably backed by strong wage growth and remain at 2%. Options to mitigate the side-effects of YCC could include widening the allowance band around its 10-year yield target, a step the BOJ took in December of 2022. The IMF forecasts that the world’s third-largest economy will expand 1.4% this year, as the removal of covid precautions encourage consumption. If Japan keeps interest rates low and sustains heavy fiscal spending to control rising living costs, the IMF said the accommodative policies will fuel growth. “Our advice for Japanese authorities there is that right now, monetary policy can remain accommodative, but it needs to prepare itself for the need to maybe start hiking,” Gourinchas said.
Finally: The sum of its parts, every U.S. state plays an integral role in this nation’s overall economy. Texas, for example, has an economic output comparable to South Korea, while California, if it were its own country, would rank 5th overall—just below Germany and Japan. The visualization below, from Visual Capitalist’s Avery Koop and Joyce Ma used 2022 annual data from the U.S. Bureau of Economic Analysis to showcase each state’s real gross domestic product. Notably, California, New York, and Texas account for almost one-third of the entire country’s economic output—a combined $6.3 trillion dollars. The only other state that has reached the trillion dollar mark is Florida with $1.1 trillion.

(Sources: All index- and returns-data from Norgate Data and Commodity Systems Incorporated; news from Reuters, Barron’s, Wall St. Journal, Bloomberg.com, ft.com, guggenheimpartners.com, zerohedge.com, ritholtz.com, markit.com, financialpost.com, Eurostat, Statistics Canada, Yahoo! Finance, stocksandnews.com, marketwatch.com, wantchinatimes.com, BBC, 361capital.com, pensionpartners.com, cnbc.com, FactSet.) Content provided by WE Sherman and Company. Securities offered through Registered Representatives of Cambridge Investment Research Inc., a broker-dealer, member FINRA/SIPC. Advisory Services offered through Cambridge Investment Research Advisors, a Registered Investment Adviser. Strategic Investment Partners and Cambridge are not affiliated. Indices mentioned are unmanaged and cannot be invested into directly. Past performance is no guarantee of future results. These opinions of Strategic Investment Partners and not necessarily those of Cambridge Investment Research, are for informational purposes only and should not be construed or acted upon as individualized investment advice.