
8-29-2022 Weekly Market Update
The very Big Picture
The long-term valuation of the market is commonly measured by the Cyclically Adjusted Price to Earnings ratio, or “CAPE”, which smooths-out shorter-term earnings swings in order to get a longer-term assessment of market valuation. A CAPE level of 30 is considered to be the upper end of the normal range, and the level at which further PE-ratio expansion comes to a halt (meaning that further increases in market prices only occur as a general response to earnings increases, instead of rising “just because”). The market is now above that level.
Of course, a “mania” could come along and drive prices higher – much higher, even – and for some years to come. Manias occur when valuation no longer seems to matter, and caution is thrown completely to the wind – as buyers rush in to buy first, and ask questions later. Two manias in the last century – the “Roaring Twenties” of the 1920s, and the “Tech Bubble” of the late 1990s – show that the sky is the limit when common sense is overcome by a blind desire to buy. But, of course, the piper must be paid, and the following decade or two were spent in Secular Bear Markets, giving most or all of the mania-gains back.
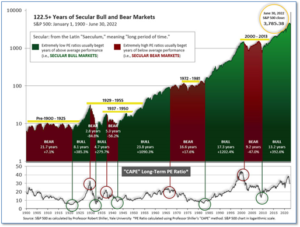
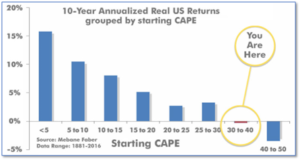
See Fig. 1 for the 100-year view of Secular Bulls and Bears. The CAPE is now at 30.40, down from the prior week’s 31.68. Since 1881, the average annual return for all ten-year periods that began with a CAPE in this range has been slightly negative (see Fig. 2).
Note: We do not use CAPE as an official input into our methods. However, if history is any guide – and history is typically ‘some’ kind of guide – it’s always good to simply know where we are on the historic continuum, where that may lead, and what sort of expectations one may wish to hold in order to craft an investment strategy that works in any market ‘season’ … whether the current one, or one that may be ‘coming soon’!
The Big Picture
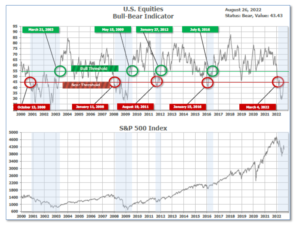
The ‘big picture’ is the (typically) years-long timeframe – the timeframe in which Cyclical Bulls and Bears operate. The U.S. Bull-Bear Indicator finished the week in Bear territory at 43.43, down from the prior week’s 45.21.
In the Quarterly- and Shorter-term Pictures
The Quarterly-Trend Indicator based on the combination of U.S. and International Equities trend-statuses at the start of each quarter – was Negative entering July, indicating negative prospects for equities in the third quarter of 2022.
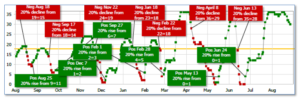
Next, the short-term(weeks to months) Indicator for US Equities turned positive on June 24, and ended the week at 30, down from the prior week’s 35.
In the Markets:
U.S. Markets: U.S. stocks moved sharply lower as investors became less optimistic that the Federal Reserve will be able to tame inflation without causing a significant economic slowdown. The Dow Jones Industrial Average gave up over 1400 points finishing the week at 32,283—a decline of -4.2%. Technology and high-growth stocks fared the worst with the tech-heavy Nasdaq Composite falling -4.4% to its lowest level in a month. By market cap, the large cap S&P 500 declined -4.0%, while the mid cap S&P 400 declined -3.0% and the small cap Russell 2000 ended the week down ‑2.9%.
International Markets: Major international market results for the week were predominantly a sea of red. Canada’s TSX pulled back -1.2%, while the United Kingdom’s FTSE 100 shed -1.6%. On Europe’s mainland, France’s CAC 40 and Germany’s DAX declined -3.4% and -4.2% respectively. In Asia, China’s Shanghai Composite ticked down -0.7% and Japan’s Nikkei retreated -1.0%. As grouped by Morgan Stanley Capital International, developed markets finished the week down -3.1%, but emerging markets bucked the trend and managed to close the week positive, up 0.3%.
Commodities: Precious metals again failed to serve as a safe-haven from the weakness in the equity markets. Gold declined -0.7% to $1749.80 per ounce, while Silver finished the week down -1.7% to $18.75. Oil rose this week with Brent crude adding 5.3% to $100.99 per barrel. West Texas Intermediate added 2.9% to $93.06. The industrial metal copper, viewed by some analysts as a barometer of world economic health due to its wide variety of uses, finished the week up 0.9%.
U.S. Economic News: The number of Americans filing for first-time unemployment benefits fell to a one-month low last week, as the labor market remains resilient despite a slowing economy. The Labor Department reported initial jobless claims fell by 2,000 to 243,000. Economists had forecast claims to total 255,000. Although the economy has slowed, most companies have not resorted to layoffs and many companies are still hiring. The strong labor market is one of the best safeguards against a severe recession, but the Federal Reserve is worried the shortage of qualified workers might worsen inflation by further pushing up wages. Meanwhile, continuing claims declined by 19,000 to 1.42 million. That number remains near a 50-year low.
The number of homebuying transaction in which a contract has been signed, but not yet closed, slipped again in July as the housing market continues to cool. The National Association of Realtors (NAR) reported its pending home sales index fell in July by 1% (analysts had expected a 3% drop). Sales dropped for a second month in July, its eighth monthly decline over the past nine months. Economists use the index to get an “early read” for the direction of home sales in subsequent months. The drop in pending home sales follows weaker data on the new home and existing home sales fronts, as well as a dip in mortgage application activity. Compared with the same time last year, sales were down ‑19.9%.
Despite other indications of a slowing economy, the Federal Reserve Bank of Chicago says the U.S. economy gained steam in July following sluggish growth over the last few months. The Chicago Fed’s National Activity Index rose 0.52 point to 0.27 last month. Economists polled by FactSet had expected a weaker reading of -0.1. The Chicago Fed’s National Activity index is composed of 85 economic indicators from four broad categories, designed to gauge overall economic activity and inflationary pressures. All four broad categories of indicators used to construct the index made positive contributions in July.
Federal Reserve Chairman Jerome Powell delivered a short and blunt message at its Jackson Hole retreat, stating the Fed will keep the job of bringing inflation down until it is done, and that the fight will be costly in terms of jobs and economic growth. “Reducing inflation is likely to require a sustained period of below-trend growth,” Powell said in his speech. “Moreover, there will very likely be some softening of labor market conditions. While higher interest rates, slower growth, and softer labor market conditions will bring down inflation, they will also bring some pain to households and businesses,” he added. Wall Street had interpreted his last speech as “dovish” after Powell described the Fed’s benchmark interest rate setting—in a range of 2.25%-2.5%–as “neutral”. This week, Powell stated that neutral “was not a place to stop or pause” rate hikes—comments seen as “very hawkish” by market participants who drove the Dow Jones industrials to a loss of 1,008 points on Friday.
U.S. businesses grew more slowly this month as high inflation and rising interest rates weighed on consumer spending, a pair of surveys of services and manufacturing activity showed. For the vast ‘services’ side of the U.S. economy, S&P Global’s U.S. services sector index dropped to 44.1 from 47.3—its fifth decline in a row and its weakest reading since May of 2020. The U.S. manufacturing index slipped to 51.3 from 52.2—its lowest reading in two years. Readings above 50 signify expansion, while those below indicate contraction. Both manufacturers and service-oriented companies such as retailers reported waning sales in August and the lowest demand in more than two years. On a positive note, the cost of supplies eased for a third month in a row. That’s a sign inflation pressures may ease following a big run up earlier this year.
Two key gauges of inflation showed inflation pulled back for the first time in more than two years. The Personal Consumption Expenditures Index (PCE) is rumored to be the Federal Reserve’s “preferred” measure of inflation over the more widely known Consumer Price Index (CPI). The PCE ticked down -0.1% in July, predominantly due to tumbling gas prices. The decline was the first pullback in the PCE since April 2020. Economists had predicted an unchanged reading. But the narrower measure of inflation that omits food and energy costs, core PCE, edged up 0.1%. That was below the consensus forecast of 0.2%. The rate of inflation over the past year dropped to 6.3% from 6.8% in the prior month. Chief economist Gus Faucher of PNC Financial Services stated, “The open question is whether the Fed can calibrate its rate increases finely enough to push inflation down to 2% over the next couple of years, but without pushing the economy into recession.”
The outlook of the nation’s consumers improved in August as falling energy prices helped lower inflation expectations to their lowest level since December of last year. The University of Michigan reported its index of consumer sentiment rose 3.1 points to 58.2 this month. Economists had expected a reading of just 55.2. Inflation remains a top concern for American consumers, though falling gas prices and attenuating price increases on other goods has helped to lift their economic outlooks. “The gains in sentiment were seen across age, education, income, region, and political affiliation, and can be attributed to the recent deceleration in inflation,” wrote Joanne Hsu, director of the survey. A gauge of consumer’s views of current conditions rose to 58.6 in August from 58.1 in July, while an indicator of expectations for the next six months jumped to 58 in August from 47.3 last month.
International Economic News: Economists at Desjardins are predicting Canada will enter a mild recession in the first half of 2023 as aggressive interest rate hikes, a cooling housing market, and weak growth in the United States drag on the country’s economic outlook. In their report, Desjardins economists said bringing soaring inflation back to a 2 per cent range “won’t be easy” and a soft landing – where inflation is tamed without leading to a recession – has become “increasingly unlikely.” Also in Canada, German Chancellor Olaf Scholz stated he hopes Canadian liquefied natural gas would help ease its shift away from Russian gas imports. “As Germany is moving away from Russian energy at warp speed, Canada is our partner of choice,” said Scholz at a German-Canadian economic conference in Toronto. “For now, this means increasing our LNG imports. We hope that Canadian LNG will play a major role in this,” he said.
Across the Atlantic, growth in UK economic activity slowed more than expected to an 18-month low as manufacturing shrank on weaker demand and shortages of both supplies and qualified labor. A preliminary “flash” reading of the United Kingdom’s composite Purchasing Managers’ Index (PMI) from S&P/Cips Global showed activity dropped to 50.9 in August, from 52.1 last month. That is the lowest reading since February 2021, when the country was in its COVID-related lockdown. The reading was weaker than the consensus forecast of 51.1 and only marginally above the neutral 50-level, which separates expansion from contraction. Furthermore, analysts aren’t expecting a turnaround anytime soon. Paul Dales, chief UK economist at Capital Economics, said “we suspect the composite PMI will be ringing the recession alarm bell before long”, adding that he expected a recession in the third quarter after official data showed that the economy contracted in the second quarter.
On Europe’s mainland, weakening economies in Germany and France piled more pressure on markets as decades-high inflation and surging gas prices drag Europe towards recession. The S&P flash composite Purchasing Managers’ Index (PMI), which tracks manufacturing and services, showed that a downturn in Germany, Europe’s biggest economy, deepened in August due to high inflation and rising interest rates. The PMI data also showed that the French economy contracted in August for the first time in 18 months. “The PMIs are going to feed into the pessimistic narrative,” said Michael Hewson, chief markets analyst at CMC Markets. Furthermore, Hewson doesn’t see a recovery anytime soon. Hewson added, “I can’t see the Ukraine war coming to an end anytime soon; that would be the catalyst for a market rally. That is going to keep pressure on energy prices and as for the euro, the only way is down.”
In Asia, several major investment banks including Goldman Sachs and Nomura downgraded their economic forecasts for China in 2022 to 3% or less. This is far below the 5.5% growth target set by the Chinese government. The Chinese economy has deteriorated in recent months because of COVID lockdowns and a deepening real estate downturn. A record-breaking heatwave and drought is also slowing growth. Several international businesses, including Tesla and Toyota, have faced disruption at factories due to power outages. In response, China’s government has unveiled 19 new measures to shore up its economy and “secure drinking water” supplies. The new measures announced by China’s cabinet amount to more than 1 trillion yuan ($146 billion) in funding to improve infrastructure, ease power shortages, and secure water and rice production.
The Japanese government reiterated its assessment that the economy continues to recover from the coronavirus pandemic fallout, but warned of rising commodity prices taking a toll on households and businesses. “The Japanese economy is picking up moderately,” the Cabinet Office said in its overall assessment for August, while upgrading its view on industrial production and public investment. As for short-term prospects, the monthly report warned of downside risks derived from “a slowing down of overseas economies due to global monetary tightening” and called for attention to the “impact of price increases on households and businesses and supply-side constraints.” Of note, the government revised upward its assessment of industrial production for the first time seven months, saying it is showing signs of picking up as the impact of Chinese lockdowns gradually recede.
Finally: Once a company has reached such prominence that its very name becomes the verb for its service, it generally has staying power (feel free to “Google it”). Not so much with video-conferencing platform Zoom. This week Zoom reported its slowest quarter ever of revenue growth, with sales rising just 8% over the past year, sending its stock plummeting (another) 16%. That leaves the company’s market cap at less than $25 billion, a fraction of its $162 billion market cap at the height of Zoom’s go-go days of the pandemic when its valuation approached some of the largest telecom and communications companies in the world. (Chart from chartr.co)

(Sources: All index- and returns-data from Yahoo Finance; news from Reuters, Barron’s, Wall St. Journal, Bloomberg.com, ft.com, guggenheimpartners.com, zerohedge.com, ritholtz.com, markit.com, financialpost.com, Eurostat,0020Statistics Canada, Yahoo! Finance, stocksandnews.com, marketwatch.com, wantchinatimes.com, BBC, 361capital.com, pensionpartners.com, cnbc.com, FactSet.) Content provided by WE Sherman and Company. Securities offered through Registered Representatives of Cambridge Investment Research Inc., a broker-dealer, member FINRA/SIPC. Advisory Services offered through Cambridge Investment Research Advisors, a Registered Investment Adviser. Strategic Investment Partners and Cambridge are not affiliated. Indices mentioned are unmanaged and cannot be invested into directly. Past performance is no guarantee of future results