
9-5-2022 Weekly Market Update
The very Big Picture
The long-term valuation of the market is commonly measured by the Cyclically Adjusted Price to Earnings ratio, or “CAPE”, which smooths-out shorter-term earnings swings in order to get a longer-term assessment of market valuation. A CAPE level of 30 is considered to be the upper end of the normal range, and the level at which further PE-ratio expansion comes to a halt (meaning that further increases in market prices only occur as a general response to earnings increases, instead of rising “just because”). The market is now above that level.
Of course, a “mania” could come along and drive prices higher – much higher, even – and for some years to come. Manias occur when valuation no longer seems to matter, and caution is thrown completely to the wind – as buyers rush in to buy first, and ask questions later. Two manias in the last century – the “Roaring Twenties” of the 1920s, and the “Tech Bubble” of the late 1990s – show that the sky is the limit when common sense is overcome by a blind desire to buy. But, of course, the piper must be paid, and the following decade or two were spent in Secular Bear Markets, giving most or all of the mania-gains back.
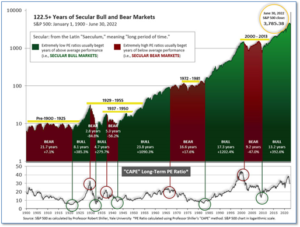
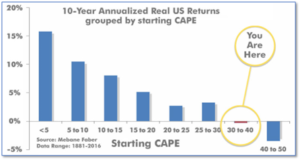
See Fig. 1 for the 100-year view of Secular Bulls and Bears. The CAPE is now at 29.41, down from the prior week’s 30.40. Since 1881, the average annual return for all ten-year periods that began with a CAPE in this range has been slightly positive to slightly negative (see Fig. 2).
Note: We do not use CAPE as an official input into our methods. However, if history is any guide – and history is typically ‘some’ kind of guide – it’s always good to simply know where we are on the historic continuum, where that may lead, and what sort of expectations one may wish to hold in order to craft an investment strategy that works in any market ‘season’ … whether the current one, or one that may be ‘coming soon’!
The Big Picture:
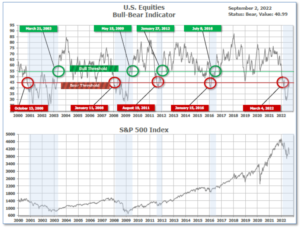
The ‘big picture’ is the (typically) years-long timeframe – the timeframe in which Cyclical Bulls and Bears operate. The U.S. Bull-Bear Indicator finished the week in Bear territory at 40.99, down from the prior week’s 43.43.
In the Quarterly- and Shorter-term Pictures
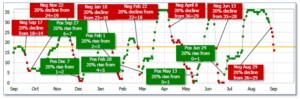
The Quarterly-Trend Indicator based on the combination of U.S. and International Equities trend-statuses at the start of each quarter – was Negative entering July, indicating negative prospects for equities in the third quarter of 2022.
Next, the short-term(weeks to months) Indicator for US Equities turned negative on August 29, and ended the week at 16, down from the prior week’s 30.
In the Markets:
U.S. Markets: Major U.S. stock indexes finished the week lower as investors continued to digest the implications of hawkish messages from Federal Reserve officials. The S&P 500 Index extended the daily losing streak that began with Fed Chair Jerome Powell’s August 26 speech at the central bank’s Jackson Hole conference. The Dow Jones Industrial Average ended the week down 965 points to 31,318 – a decline of -3.0%. The technology-heavy NASDAQ Composite gave up -4.2% to 11,631. By market cap, the large cap S&P 500 retreated -3.3%, the mid cap S&P 400 fell ‑4.3% and the small cap Russell 2000 declined -4.7%.
International Markets: Almost all major international indexes finished the week down as well. Canada’s TSX retreated -3.0% while the United Kingdom’s FTSE 100 gave up -2.0%. On Europe’s mainland, France’s CAC 40 ended down -1.7%, while Germany’s DAX managed a slight 0.6% uptick. China’s Shanghai Composite declined -1.5%. Japan’s Nikkei gave up -3.5%. As grouped by Morgan Stanley Capital International, developed markets fell -3.6%. Emerging markets ended the week down -3.1%.
Commodities: Major commodities also finished the week to the downside. The traditionally-defensive asset Gold failed to deliver on that premise and shed -1.6% to $1722.60 per ounce, while Silver declined an even greater -4.6% to $17.88. Energy pulled back as well. West Texas Intermediate crude oil declined -6.7% to $86.87 per barrel, while Brent crude retreated -5.7% to $93.04. The industrial metal copper, viewed by some analysts as a barometer of global economic health due to its wide variety of uses, plunged -7.7%.
August Summary: August was a difficult month for U.S. stocks as all the major benchmarks finished the month in the red. The Dow shed -4.1%, while the NASDAQ fared the worst—down -4.6%. Large caps and mid caps declined -4.2% and ‑3.3%, respectively. Small caps did the “least worst” and finished the month down -2.2%. August was difficult for international markets as well. Canada’s TSX retreated -1.8%, and the FTSE declined -1.9%. France and Germany shed -5.0% and -4.8%, respectively. China gave up -1.6%. Japan was the only major market to finish the month up, gaining a modest 1.0%. As grouped by Morgan Stanley Capital International, developed markets ended the month down -6.1%. Emerging markets ended down -1.3%. In the commodities markets, Gold gave up -3.1%, while Silver plunged a large ‑11.5%. Oil finished the month down -9.2%, and copper closed the month of August down -1.6%.
U.S. Economic News: The number of people who applied for first-time unemployment benefits at the end of August fell to a nine-week low last week, showing no sign that a slowing U.S. economy is triggering widespread layoffs. The Labor Department reported new jobless claims declined by 5,000 to 232,000 in the seven days ended August 27. Economists had forecast new claims would total 245,000. New unemployment filings had fallen to as low as 166,000 in late March, while topping out at 261,000 recently. By most metrics, the labor market remains extremely tight—too tight in the view of the Federal Reserve. The central bank wants to see hiring slow and unemployment rise slightly to help ease inflation. Meanwhile, the number of people already collecting benefits, so-called “continuing claims”, rose by 26,000 to 1.44 million. That number is reported with a one-week delay.
The U.S. added over 315,000 new jobs in August according to the Labor Department’s monthly jobs report, showing businesses still have a big appetite for hiring even as the economy slows. The increase in hiring basically matched economists’ estimates. Economists had forecast 318,000 new jobs would be created. Meanwhile, the unemployment rate ticked up slightly to 3.7% – mostly because more people entered the workforce in search of jobs. That number is at its highest level in six months. In the report, professional businesses led the way with 68,000 new employees added, while employment also rose in health care, hotels and restaurants, retail, manufacturing, and finance. No major industry reported a decline in employment, a sign of broad strength in the labor market. Jennifer Lee, senior economist at BMO Capital Markets summed up the report succinctly, “So was this good or bad? Both. This does not change the view that the labor market is ‘clearly out of balance,’ to quote the Fed chairman, and will keep the central bank tightening into year-end.”
The number of jobs openings in the nation rose to 11.2 million in July, the first increase in four months. However, companies aren’t as anxious as they were to fill the open spots – the number of jobs being filled slipped for a fourth month. The so-called “quits rate”, rumored to be the Federal Reserve’s preferred measure of the health of the labor market as it is presumed a worker would only leave a job in favor of a more lucrative one, dipped to 2.7%. However, despite the decline it remains near the peak of 3% it reached at the end of 2021. Indeed Hiring Lab senior economist AnnElizabeth Konkel stated, “While there are some signs of cooling, all in all the labor market is still hot. Layoffs remain low and the elevated quits rate and job opening continue to be signals of strength.”
The rate of home price rises continued to slow sharply, according to the latest report from S&P Case-Shiller. Case-Shiller’s 20-city home price index slowed to an 18.6% annual increase in June, down almost 2 full percentage points from its previous reading. The annual rate of home price increases has slowed sharply since reaching its peak of 21.2% in April. A pair of Florida cities, Tampa and Miami, reported the highest year-over-year gains among the 20 cities in June, along with Dallas, Texas. Cleveland, Minneapolis, and Washington D.C. reported the lowest year-over-year gains. A broader measure of home prices, Case-Shiller’s national index, rose just 0.3% from May to June. That was the lowest monthly increase in two years. Stephen Stanley, chief economist at Amherst Pierpont, wrote in a note, “The housing sector is weakening sharply. June is the first month that the official price data began to show the shift to cooler demand for homes.”
Confidence among the nation’s consumers rose for the first time in four months predominantly due to falling prices at the gas pump. The Conference Board reported its measure of consumer confidence jumped 7.5 points to 103.2. Economists were expecting a reading of just 97.4. In the details, the measure of how consumers feel about the economy right now, the ‘present situation index’, rose 5.7 points to 145.4, while a similar gauge that assesses how consumers feel about the next six months jumped to 75.1 from 65.6 – its highest level in four months. Lynn Franco, senior director of economic indicators at the board stated, “August’s improvement in confidence may help support spending, but inflation and additional rate hikes still pose risks to economic growth in the short term.”
A key measure of manufacturing activity held steady in August, as new orders and employment turned positive, while inflation lessened. The Institute for Supply Management (ISM) reported its U.S. manufacturing index came in at 52.8. While the reading matched its worst headline number since early in the pandemic, it was better than expected. Economists had forecast the index to slip to 51.8. Readings above 50 signify growth. One red flag: Numerous executives said inventories are too high. In the details, the index of new orders rose 3.3 points to 51.3, while the employment gauge turned positive climbing 4.3 points to 54.2. The prices index, a measure of inflation, sank to 52.5 – its lowest level since June 2020. That gauge has fallen five months in a row since peaking in March at 87.1. Oren Klatchkin, lead U.S. economist at Oxford Economics said, “The final months of 2022 will be quite challenging for manufacturers. Soft domestic demand and recession worries will weigh on growth.”
International Economic News: The Canadian economy grew at an annual rate of 3.3% in the second quarter, missing estimates. In its latest report, Statistics Canada showed the economy expanded for a fourth consecutive quarter, driven by increased businesses and household spending. Businesses ramped up their investments in inventories, which served as the major contributor to the growth. Businesses also increased their investments in engineering structures and machinery and equipment. According to the federal agency, real GDP grew by 0.8% in the second quarter, with the economy staying flat in May before seeing growth of 0.1% in June. Of note, an early reading for July points to a contraction of 0.1%.
Across the Atlantic, the British pound suffered its worst month since the aftermath of the Brexit referendum, and analysts expect the sterling to fall further as a “slowing economy and political paralysis” grip the U.K. Analysts say the United Kingdom faces a rapidly deteriorating cost-of-living crisis as food and energy prices soar, with millions of households facing poverty this winter. The pound lost 4.5% versus the U.S. dollar in August, falling to just $1.16 – the lowest since March 2020. Fears of a long recession and the likelihood of higher public spending to cope with the cost-of-living crisis has sent the interest rate on Britain’s debts soaring towards its biggest monthly rise in almost 40 years.
On Europe’s mainland, after Gazprom cut deliveries to major French utility Engie, France accused Moscow of using energy supplies as “a weapon of war.” Engie announced Gazprom would be delivering less gas due to an “unspecified contractual dispute”. The main conduit for Russian gas into Europe, Nord Stream 1, was shut off for maintenance this week and with winter coming, demand from businesses and households to fill storage facilities has further kindled France’s soaring energy costs. France’s Energy Transition Minister Agnes Pannier-Runacher stated, “Very clearly Russia is using gas as a weapon of war and we must prepare for the worst case scenario of a complete interruption of supplies.” When asked if Gazprom will restart gas flows through Nord Stream 1, Kremlin spokesman Dmitry Peskov stated, “There are guarantees that, apart from technological problems caused by sanctions, nothing hinders the supplies.”
Rampantly-rising energy prices forced Europe’s top steelmaker to close plants. ArcelorMittal, the world’s largest steelmaker, stated exorbitantly high energy costs have forced a series of smelter closures with production becoming uneconomical. The reasoning was that rising energy prices devastatingly impact the company’s competitiveness in steel production. Reiner Blaschek, CEO of ArcelorMittal Germany, wrote, “As an energy-intensive industry, we are extremely affected. With gas and electricity prices increasing tenfold within just a few months, we are no longer competitive in the market that is 25% supplied by imports.” By the end of September, two plants in Germany, one in Bremen and another in Hamburg, will both be partially closed. With Russian energy giant, Gazprom, decreasing output from Nord Stream 1, power prices will further curb industrial output.
In Asia, China is suffering from one of its worst earnings recessions on record as Beijing’s zero-COVID policy and an evolving real estate crisis weigh on the country’s listed companies. More than 4,800 Chinese companies listed in Shanghai, Shenzhen and Beijing have now released their earnings for the first half of the year and in the words of one analyst, “it was a bloodbath.” As many as 53% posted a decline in net profit, according to data from Wind and Choice, two major financial information services in the country. That was almost as bad as 2020, when companies posted their worst earnings season on record as the country came to a near standstill during the initial coronavirus outbreak. By another measure, though, the start of this year was worse. The number of companies reporting a loss hit a record high of nearly 900 in the first half. In 2020, about 780 companies lost money. Larry Hu, chief China economist for Macquarie Group, said the poor earnings reflected China’s slowing economy, which is being dragged down by the real estate slump, the worsening Covid situation, and the weakening global economy.
In the world’s third largest economy, Bank of Japan board member Junko Nakagawa asserted the need to keep that country’s monetary policy ultra-loose for the time being. While robust overseas demand and the weak yen have boosted manufacturers’ profits, supply disruptions caused by China’s strict Covid-19 lockdowns have hurt Japanese exports and output, Nakagawa said. Domestic consumption is picking up, though the fallout from a broad range of price hikes for daily necessities clouds the outlook, she said. “For the economy to recover, it’s crucial that the damage to consumption from price rises remains minimum,” Nakagawa said. The BOJ has pledged to keep monetary policy ultra-loose to support a fragile economic recovery, remaining an outlier among other central banks that are raising interest rates to combat soaring inflation. Japan’s core consumer prices rose 2.4% in July from a year earlier, marking its fastest pace in seven-and-a-half years.
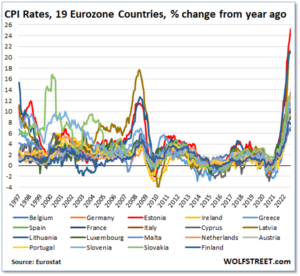
Finally: As bad as inflation seems in the U.S., it is much worse in the Eurozone where inflation jumped 9.1% in August – a new record for Eurozone data that goes back to 1997. Estonia led the way with a huge 25.2% rise, while Germany hit a record 8.8%. After years of money printing by the European Central Bank (ECB) that turned into an absolute torrent during the pandemic, inflation “suddenly” spiked in early 2021. By July 2021, Eurozone inflation had shot past the ECB’s inflation target of 2%, and by August inflation had hit 3% and continued shooting higher. At the time, the ECB parroted the Federal Reserve’s line that this inflation was “transitory”, and it continued on its course of non-stop money printing. By January 2022, just before Russia’s invasion of Ukraine, Eurozone inflation had shot to 5.1%, with two Baltic states already in the double-digits. And since the invasion of Ukraine, the upward trajectory of inflation has continued unabated. The chart below, from wolfstreet.com, represents every European central banker’s nightmare.
(Sources: All index- and returns-data from Yahoo Finance; news from Reuters, Barron’s, Wall St. Journal, Bloomberg.com, ft.com, guggenheimpartners.com, zerohedge.com, ritholtz.com, markit.com, financialpost.com, Eurostat,0020Statistics Canada, Yahoo! Finance, stocksandnews.com, marketwatch.com, wantchinatimes.com, BBC, 361capital.com, pensionpartners.com, cnbc.com, FactSet.) Content provided by WE Sherman and Company. Securities offered through Registered Representatives of Cambridge Investment Research Inc., a broker-dealer, member FINRA/SIPC. Advisory Services offered through Cambridge Investment Research Advisors, a Registered Investment Adviser. Strategic Investment Partners and Cambridge are not affiliated. Indices mentioned are unmanaged and cannot be invested into directly. Past performance is no guarantee of future results