
8-22-2022 Weekly Market Update
The very Big Picture
The long-term valuation of the market is commonly measured by the Cyclically Adjusted Price to Earnings ratio, or “CAPE”, which smooths-out shorter-term earnings swings in order to get a longer-term assessment of market valuation. A CAPE level of 30 is considered to be the upper end of the normal range, and the level at which further PE-ratio expansion comes to a halt (meaning that further increases in market prices only occur as a general response to earnings increases, instead of rising “just because”). The market is now above that level.
Of course, a “mania” could come along and drive prices higher – much higher, even – and for some years to come. Manias occur when valuation no longer seems to matter, and caution is thrown completely to the wind – as buyers rush in to buy first, and ask questions later. Two manias in the last century – the “Roaring Twenties” of the 1920s, and the “Tech Bubble” of the late 1990s – show that the sky is the limit when common sense is overcome by a blind desire to buy. But, of course, the piper must be paid, and the following decade or two were spent in Secular Bear Markets, giving most or all of the mania-gains back.
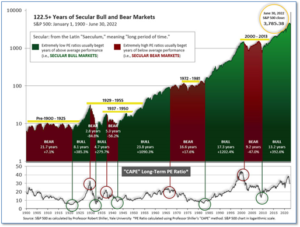
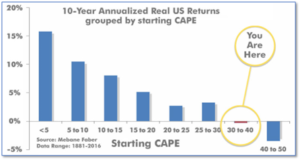
See Fig. 1 for the 100-year view of Secular Bulls and Bears. The CAPE is now at 31.68, down from the prior week’s 32.07. Since 1881, the average annual return for all ten-year periods that began with a CAPE in this range has been slightly negative (see Fig. 2).
Note: We do not use CAPE as an official input into our methods. However, if history is any guide – and history is typically ‘some’ kind of guide – it’s always good to simply know where we are on the historic continuum, where that may lead, and what sort of expectations one may wish to hold in order to craft an investment strategy that works in any market ‘season’ … whether the current one, or one that may be ‘coming soon’!
The Big Picture
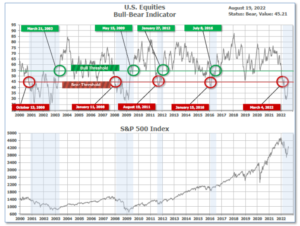
The ‘big picture’ is the (typically) years-long timeframe – the timeframe in which Cyclical Bulls and Bears operate. The U.S. Bull-Bear Indicator finished the week in Bear territory at 45.21, up from the prior week’s 44.38.
In the Quarterly- and Shorter-term Pictures
The Quarterly-Trend Indicator based on the combination of U.S. and International Equities trend-statuses at the start of each quarter – was Negative entering July, indicating negative prospects for equities in the third quarter of 2022.
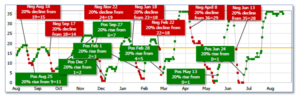
Next, the short-term(weeks to months) Indicator for US Equities turned positive on June 24, and ended the week at 35, unchanged from the prior week.
In the Markets:
U.S. Markets: U.S. stocks gave back a portion of last week’s strong gains after St. Louis Fed President James Bullard, typically a “hawkish” policymaker, appeared to dampen hopes that inflationary pressures had peaked. “The idea that inflation has peaked is…not statistically really in the data at this point,” Bullard asserted in an interview. The Dow Jones Industrial Average declined 54 points finishing the week at 33,707, a decline of -0.2%. The technology-heavy NASDAQ Composite retreated -2.6% to 12,705. By market cap, the large cap S&P 500 declined -1.2%, the S&P 400 mid-caps retreated -1.4%, and the small cap Russell 2000 fared the worst, ending the week down -2.9%.
International Markets: Major international markets finished the week mixed. Canada’s TSX fell -0.3%, while the United Kingdom’s FTSE 100 rose 0.7% – its fifth consecutive week of positive closes. France’s CAC 40 and Germany’s DAX closed down -0.9% and -1.8%, respectively. In Asia, China’s Shanghai Composite finished down –0.6%, while Japan’s Nikkei added 1.3%. As grouped by Morgan Stanley Capital International, developed markets finished the week down ‑3.1% and emerging markets shed -2.8%.
Commodities: Precious metals and energy finished the week to the downside as well. Gold closed down ‑2.9% to $1762.90 per ounce while Silver dropped a steep -7.9% to $19.07. Brent crude oil shed -2.1% to $95.95, while West Texas Intermediate finished down -1.8% to $90.44. The industrial metal copper, viewed by some analysts as a barometer of global economic health due to its wide variety of uses, gave up a slight -0.1%.
U.S. Economic News: The number of Americans filing for first-time unemployment benefits fell by just 2,000 last week to 250,000, indicating layoffs remain near historically low levels and the labor market remains robust. Economists had expected new claims to total 260,000. Most companies are still reporting difficulty finding enough skilled eligible workers to fill open positions. Meanwhile, continuing claims, which counts the number of people already receiving benefits ticked up by 7,000 to 1.44 million. That number remains near a 50-year low. Economic adviser Stuart Hoffman of PNC Financial Services summed up the report succinctly writing, “The labor market remains in good shape. However, the rise in initial claims since April is a cool breeze blowing at the hot labor market this summer.”
The National Association of Realtors (NAR) reported sales of existing homes fell for a sixth consecutive month in July, its weakest level of sales since May 2020. Excluding the pandemic, the level of sales activity was its lowest since November 2015. Compared with the same time last year, sales were down 20.2%. As expected, prices moderated as well. The median price of an existing home fell to $403,800. Meanwhile, there’s currently a 3.3-month supply of homes available on the market. Analysts generally consider a 6-month supply of homes a “balanced” housing market. Sales declined across all regions of the country, but the West saw a “dramatic decline” in sales from a year ago of 30%.
Confidence among the nation’s homebuilders continued to pull back in August, its eighth consecutive month of declines. The National Association of Home Builders (NAHB) reported its Home Builder Confidence Index fell to 49 this month. Economists had expected a reading of 54. The current reading is the first time since May of 2020 that the index fell below its break-even measure of 50. At the same time last year, the index stood at 75. All 3 gauges that make up the headline reading fell. Current sales conditions fell by 7 points, while the component that tracks buyer traffic pulled back 5 points to 32—its lowest level since 2014 (outside of the pandemic). The gauge that assesses sales expectations for the next six months fell by 2 points. All regions posted a drop in builder confidence, with the West and Northeast leading the pack with 11-point and 9-point declines, respectively. “Tighter monetary policy from the Federal Reserve and persistently elevated construction costs have brought on a housing recession,” NAHB’s chief economist, Robert Dietz, said in a statement.
The number of new homes under construction fell -9.6% in July to 1.45 million–their lowest level since early 2021, the Commerce Department reported. Economists had expected housing starts to drop to a 1.52 million rate. On an annual basis, total housing starts fell -8.1% from this time last year. Meanwhile, building permits, which analysts use as a guide for future building activity, fell 1.3% to 1.67 million. This reading exceeded the consensus forecast of a 1.63 million decline.
Sales at U.S. retailers fell in July, but it wasn’t necessarily a negative for the U.S. economy. Sales were down largely due to cheaper gasoline and fewer purchases of new cars and trucks. Sales were stronger in other areas of the economy, a good sign that should help ease recession worries. If auto and gasoline sales are set aside, sales actually rose a solid 0.7% in July. Internet sales surged 2.7% helped by Amazon Prime Day. Inflation did not play as big a role as in previous months. The cost of living remained unchanged in July for the first time since May 2020, just two months after the start of the coronavirus pandemic. Michael Pearce, senior U.S. economist at Capital Economics stated, “While overall retail sales were unchanged in July, the details were far more encouraging.”
Minutes from the Federal Reserve’s last meeting released this week showed the Fed plans to continue raising interest rates in to so-called “restrictive territory” to cool inflation and anchor consumers’ inflation expectations. Then it hopes to take a break. Central bankers remain alarmed over persistently high inflation and a “very tight” labor market, the minutes show. As such, they anticipate having to raise the target range for the short-term interest rates beyond the “neutral” rate and toward a restrictive policy stance. July’s 0.75 percentage point rate hike brought the federal-funds rate to a range of 2.25% to 2.5%. Fed members also suggested that the pace of rate hikes and balance sheet shrinkage would be data dependent and that it likely would become appropriate at some point to slow the pace of tightening to assess the impact of policy changes on bringing down inflation.
International Economic News: Inflation in Canada is not likely to return to the Bank of Canada’s 2% target until 2024 after “possibly peaking in June”, analysts say. In its bid to return inflation to its target, the BoC raised its benchmark interest rate by 225 basis points to 2.50%–including a full percentage-point move at its last policy decision in July. Josh Nye, senior economist at Royal Bank of Canada wrote in a note, “Even with the economy likely to see a mild recession next year, we think it will take until 2024 to get inflation back to target, or reasonably close.” Canadian inflation slowed to 7.6% in July on lower gasoline prices, down from an almost 40-year high of 8.1% in June, but measures of core price pressures that strip out the most volatile components, such as energy, have continued to climb.
Across the Atlantic, confidence among consumers in the United Kingdom has fallen to its lowest level in almost 50 years as the rising cost of living weighs on personal finances and economic prospects. Research from Nuremberg-based data provider GfK showed the August index score for overall consumer confidence fell to -44 from -41 the previous month. That was the lowest reading since records were first produced in 1974. Also of note, retail sales volumes were down ‑3.4% in July on an annual basis, but the value of sales was up 7.8% over the same period, highlighting the rise in prices on the street.
On Europe’s mainland, more French workers than ever quit their jobs at the end of 2021 and start of 2022, as the balance of bargaining power shifted away from employers, a labor ministry study showed. Between October and March, over 1 million workers quit, the ministry’s Dares research body showed. Ninety percent of those workers had coveted permanent labor contracts which offer some of the highest job protection in the world. Growing numbers of people across many countries have left their jobs during the COVID-19 pandemic as skilled workers start to re-evaluate careers and life choices – a phenomenon that a U.S. management professor famously dubbed the “Great Resignation”. “Bargaining power is changing in favor of employees”, Dares said.
Producer prices in Germany jumped at their fastest pace on record in July, underscoring the gloomy economic outlook in Europe’s largest economy and the broader European Union economy as well. Producer prices, which serve as a leading indicator for inflation at the consumer level, surged an annualized 37.2% last month—the biggest rise since records began in 1949. The monthly rise of 5.3% was also the highest on record. “The outlook for the further development (of the economy) is currently noticeably gloomy,” the finance ministry said in its August monthly report, adding that it was marked by “a high degree of uncertainty”. The record increases in producer prices were driven largely by skyrocketing energy prices, which as a whole were up 105% compared with the same time last year.
In Asia, China’s central bank cut its key lending rates in a surprise move this week as data showed the economy unexpectedly slowing in July. China’s National Bureau of Statistics showed industrial output grew just 3.8% in July, below the 3.9% expansion in June and far below the consensus forecast of 4.6% growth. However, analysts are increasingly concerned about China’s real estate market. According to Nikkei Asia, real estate defaults have soared over the past 12 months and S&P Global Ratings warned around 20% of Chinese developers it rates are at risk of insolvency.
Japan’s economy grew at an annualized 2.2% in the second quarter, as robust private consumption provided a boost to its delayed recovery from the COVID-19 pandemic. The relatively strong economic data comes after GDP grew just 0.1% in the first quarter. The growth was driven primarily by a 1.1% rise in private consumption which makes up more than half of Japan’s GDP. The latest result means that Japan’s $4.07 trillion USD economy is now larger than it was before the onset of the pandemic. Still, the world’s third-largest economy faces a weakening yen along with the same issues as the rest of the developed world—slowing global growth, rising inflation and supply chain constraints.
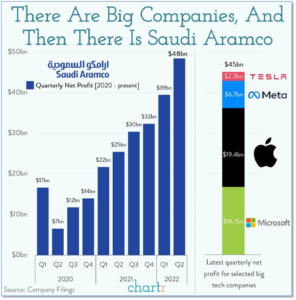
Finally: If you’ve been wondering where all the extra money you’ve been spending to fill up your gas tank has been going, there’s a good bet at least some of it made it to Saudi Arabia’s energy behemoth Saudi Aramco. Saudi Aramco isn’t just big, it’s huge. It announced an eye-watering $48.4 billion in net income in the second quarter alone. That’s 2.5 times Apple’s $19.4 billion, and exceeded the sum total of Apple, Microsoft, Meta/Facebook and Tesla combined! (Chart from chartr.co)
(Sources: All index- and returns-data from Yahoo Finance; news from Reuters, Barron’s, Wall St. Journal, Bloomberg.com, ft.com, guggenheimpartners.com, zerohedge.com, ritholtz.com, markit.com, financialpost.com, Eurostat,0020Statistics Canada, Yahoo! Finance, stocksandnews.com, marketwatch.com, wantchinatimes.com, BBC, 361capital.com, pensionpartners.com, cnbc.com, FactSet.) Content provided by WE Sherman and Company. Securities offered through Registered Representatives of Cambridge Investment Research Inc., a broker-dealer, member FINRA/SIPC. Advisory Services offered through Cambridge Investment Research Advisors, a Registered Investment Adviser. Strategic Investment Partners and Cambridge are not affiliated. Indices mentioned are unmanaged and cannot be invested into directly. Past performance is no guarantee of future results.