
8-19-19 Weekly Market Update
The Very Big Picture:
The long-term valuation of the market is commonly measured by the Cyclically Adjusted Price to Earnings ratio, or “CAPE”, which smooths out shorter-term earnings swings in order to get a longer-term assessment of market valuation. A CAPE level of 30 is considered to be the upper end of the normal range, and the level at which further PE-ratio expansion comes to a halt (meaning that increases in market prices only occur in a general response to earnings increases, instead of rising “just because”). The market is currently at that level.
Of course, a “mania” could come along and drive prices higher – much higher, even – and for some years to come. Manias occur when valuation no longer seems to matter, and caution is thrown completely to the wind as buyers rush in to buy first and ask questions later. Two manias in the last century – the 1920’s “Roaring Twenties” and the 1990’s “Tech Bubble” – show that the sky is the limit when common sense is overcome by a blind desire to buy. But, of course, the piper must be paid and the following decade or two are spent in Secular Bear Markets, giving most or all of the mania gains back.
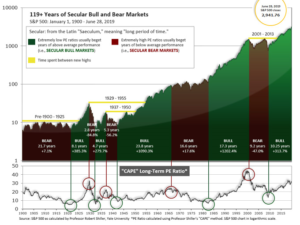
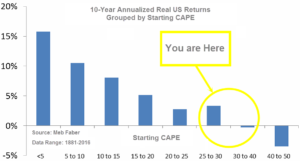
See Fig. 1 for the 100-year view of Secular Bulls and Bears. The CAPE is now at 28.95, down from the prior week’s 29.53, above the level reached at the pre-crash high in October, 2007. Since 1881, the average annual return for all ten year periods that began with a CAPE around this level have been in the 0% – 3%/yr. range. (see Fig. 2).
In the Big Picture:
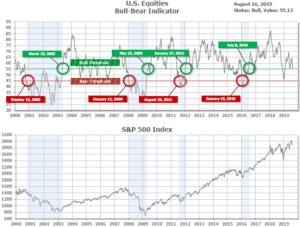
The “big picture” is the months-to-years timeframe – the timeframe in which Cyclical Bulls and Bears operate. The U.S. Bull-Bear Indicator (see Fig. 3) is in Cyclical Bull territory at 55.13, down from the prior week’s 58.35.
In the intermediate and Shorter-term picture:
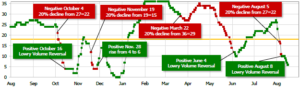
The Shorter-term (weeks to months) Indicator (see Fig. 4) is positive. The indicator ended the week at 6, down from the prior week’s 10. Separately, the Intermediate-term Quarterly Trend Indicator – based on domestic and international stock trend status at the start of each quarter – was positive entering July, indicating positive prospects for equities in the third quarter of 2019.
Timeframe summary:
In the Secular (years to decades) timeframe (Figs. 1 & 2), the long-term valuation of the market is historically too high to sustain rip-roaring multi-year returns. The Bull-Bear Indicator (months to years) remains positive (Fig. 3), indicating a potential uptrend in the longer timeframe. In the intermediate timeframe, the Quarterly Trend Indicator (months to quarters) is positive for Q3, and the shorter (weeks to months) timeframe (Fig. 4) is positive. Therefore, with three indicators positive and none negative, the U.S. equity markets are rated as Positive.
In the markets:
U.S. Markets: Financial markets in the U.S. recorded a third consecutive week of losses as trade and growth worries weighed on investor sentiment. The bulk of the week’s decline came on Wednesday as the major indexes recorded one of their worst daily declines of 2019. For the week the Dow Jones Industrial Average retreated 401 points to 25,886, a decline of -1.5%. The technology-heavy NASDAQ Composite fared the best of the major indexes, giving up a lesser -0.8%. By market cap, the large cap S&P 500 index declined -1.0%, while the mid cap S&P 400 and small cap Russell 2000 indexes declined -1.5% and -1.3%, respectively.
International Markets: Canada’s TSX retraced all of last week’s gain, ending down -1.2%. The United Kingdom’s FTSE dropped a further -1.9%; on Europe’s mainland, France’s CAC 40 retreated -0.5% and Germany’s DAX declined ‑1.1%. In Asia, China’s Shanghai Composite managed a 1.8% rebound from last week’s decline, while Japan’s Nikkei finished down -1.3%. As grouped by Morgan Stanley Capital International, developed markets finished the week down -1.1% and emerging markets gave up -0.8%.
Commodities: Gold continued its rally, adding another $15.10 to finish the week at $1523.60 an ounce, a gain of 1%. Silver added 1.1% finishing the week at $17.12 an ounce. Crude oil managed a gain of 0.6% as West Texas Intermediate closed the week at $54.81 per barrel. The industrial metal copper, viewed by some analysts as a barometer of global economic health due to its wide variety of uses, managed a second week of gains closing up a modest 0.2%.
U.S. Economic News: The number of Americans seeking first-time unemployment benefits rose to a six-week high of 220,000 last week, still far below the key 300,000 threshold that analysts use to gauge a “healthy” jobs market. The Labor Department reported initial jobless claims rose by 9,000 nationally, though most of the increase appears to have occurred in California. Economists had estimated new claims would total 213,000. The less volatile monthly average of new claims rose a lesser 1,000 to 213,750. Continuing claims, which counts the number of people already receiving benefits, increased by 39,000 to 1.73 million. That reading is at its highest level since March.
Homebuilding activity in the U.S. fell for a third consecutive month in July amid a steep decline in construction of multi-family units. The Commerce Department reported housing starts dropped 4.0% to a seasonally-adjusted annual rate of 1.191 million units. The reading missed expectations of an increase to 1.257 million units. On a positive note, single-family homebuilding, which accounts for the largest share of the housing market, increased 1.3% to 876,000 units in July—its highest level in six months. Single-family housing starts rose in the Northeast, West and Midwest, but dropped 3.9% in the South. Furthermore, in a positive sign for future activity, building permits surged over 8% to a rate of 1.336 million units, its largest gain since June 2017.
In a reassuring sign for the economy, sales at U.S. retailers posted their biggest increase in four months in July. The Commerce Department reported retail sales increased 0.7%, more than double the consensus forecast of a 0.3% increase. Sales soared 2.8% at internet retailers, a gain most likely due to Amazon’s Prime Day. However, it wasn’t just internet retailers responsible for the gain. Sales were up sharply at department stores, restaurants, and electronics outlets as well. Ben Ayers, senior economist at Nationwide stated, “The U.S. consumer continues to prop up the economy, despite the building headwinds to growth from trade disruptions and signs of weakness from other industrialized nations.”
Consumers paid more for goods and services such as gasoline and rent in July, but analysts believe the increase wasn’t enough to discourage the Federal Reserve from further interest rate cuts. The Bureau of Labor Statistics reported the Consumer Price Index rose 0.3% last month, matching economists’ forecasts. Over the past year, the cost of living increased from 1.6% to 1.8%, but it’s still far below last year’s peak of 2.9% and below the Federal Reserve’s stated goal of 2%. Core CPI, which strips out the volatile food and energy categories, also rose 0.3% last month. That number is viewed as a better source of underlying inflationary trends.
Confidence among the nation’s consumers fell to its lowest level since the beginning of the year as trade tensions continue to rise and talk increased of the possibility of a coming recession. The University of Michigan’s consumer sentiment survey fell 6.3 points to 92.1 this month. Economists had forecast a reading of 96.8. In the details, the sub-index that tracks what consumers think about their own situation and the current health of the economy fell to 107.4—near a two-year low. The measure that tracks expectations for the next 6 months declined 8.2 points to 82.3—also a two-year low. So far consumers haven’t cut back on their spending, but waning confidence could cause them to do so in the months ahead. Consumer sentiment is important, as consumer spending represents about 70% of U.S. economic activity.
Sentiment among the nation’s manufacturers remained resilient according to two regional surveys. The New York Federal Reserve’s Empire State manufacturing index rose half a point to 4.8 this month, exceeding expectations for a reading of 2.5. In Philadelphia, the Federal Reserve’s manufacturing index fell to a reading of 16.8 in August, down from 21.8 in July. Economists had expected a much bigger drop to 11.1. In the details of both readings, manufacturers were not as pessimistic about activity as had been expected. Andrew Hunter, senior U.S. economist at Capital Economics nonetheless believes that “With the latest data from China and the euro-zone pointing to continued weakness, and trade policy uncertainty intensifying, the manufacturing downturn probably still has further to run.”
International Economic News: Many portfolio managers in Canada believe that the inversion in Canada’s yield curve by the most in almost twenty years should prompt the Bank of Canada to also cut interest rates. Curve inversion, in which long-term yields dip below short-term yields, are seen by some investors as a harbinger of economic recession. Sal Guatieri, senior economist at BMO Capital Markets stated, “The Bank of Canada can’t ignore what’s happening in debt markets and the inversion of the yield curve. It’s so highly inverted now, a reduction in policy rates would at least provide some semblance of normality.” The Bank of Canada left overnight borrowing costs on hold at 1.75% in July and said it was comfortable with that stance given the domestic economy’s recovery from a series of challenges.
Across the Atlantic it was a similar yield-curve story. In the United Kingdom, the UK’s two- and 10-year curves also inverted this week for the first time since 2008. In addition, inflation data showed consumer prices were already climbing at a faster pace than the Bank of England’s target with Brexit scheduled to occur just months from now. Economists said it underscored the difficult position for policymakers, with rising inflation suggesting an interest rate increase might be necessary, but signs of an economic slowdown pointing to the opposite. On a positive note, Mike Riddell, a bond portfolio manager at Allianz Global Investors, cautioned that the UK yield curve was a less reliable recession indicator than its US counterpart. “The UK curve spent almost half the 1990s inverted yet things were fine,” he said.
Joblessness in the Eurozone’s second-largest economy fell to new 10-year low, French national statistics agency Insee reported. France’s unemployment rate fell 0.2% in the second quarter to 8.5%, its lowest level since 2009. Unemployment is down 0.6% over the past year. France’s labor minister, Muriel Penicaud, was quick to take credit for the numbers. “Government reforms are beginning to pay off for our fellow citizens,” she said. “Many jobs, particularly permanent ones, have been created because companies, especially small ones, are no longer afraid to hire.” The reading is sure to alleviate some of the pressure on French President Emmanuel Macron. Macron has been pursuing contentious labor market reforms that will cut jobless benefits and encourage the French to extend their working hours.
Germany’s economy shrank in the second quarter as global uncertainty and an escalating trade war took a toll on its manufacturers. GDP for the Eurozone’s economic powerhouse contracted 0.1% in the second quarter compared to the first, in line with analyst expectations. The reading was down from 0.4% growth in the first quarter. Carsten Brzeski, chief economist in Germany at ING stated, “Today’s GDP report definitely marks the end of a golden decade for the German economy.” The world’s fourth largest economy, and Europe’s biggest, has been hit by what analysts have described as a “perfect storm” of negative factors. Germany relies heavily on exporters that sell a large amount of goods to China and the United States, which are locked in a bitter trade dispute. Weak global auto sales have also hit the country’s carmakers, and fears of a disorderly Brexit also weigh.
China’s economy slowed more sharply than expected in July as industrial output growth slumped to a more than 17-year low. Industrial output growth slowed markedly to 4.8% in July from a year earlier, data from the National Bureau of Statistics showed. The reading was worse than even the most bearish forecast in a Reuters poll and the weakest pace since February 2002. Economists’ had forecast it would slow to 5.8%, from June’s 6.3%. Analysts say this latest report is further evidence that demand faltered across the board last month, from industrial output and investment to retail sales.
Major Japanese companies have turned pessimistic on the future of Japan’s economy, a new survey revealed. In a Kyodo News survey, nearly 70% of major Japanese companies stated the domestic economy has levelled off into stagnation from growth, while 10% believe it has already started to contract. The survey participants, including international behemoths such as Toyota Motor Corp and Sony Corp, were also cautious about the economic outlook for next year with many voicing concern about a drop in consumption following the planned consumption tax hike in October as well as a spread of protectionist trade policies around the world. Among the 112 companies surveyed, 66% said the Japanese economy was flat, 23% said it was gradually expanding, and 10% saw it as already in recession.
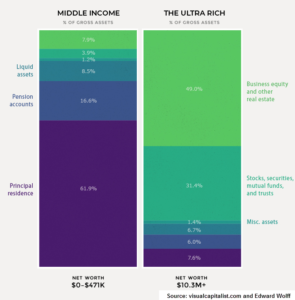
Finally: “The Great Gatsby” author F. Scott Fitzgerald opened his story “The Rich Boy” with “Let me tell you about the very rich. They are different from you and me.” One way they are “different from you and me” is in the makeup of their net worth. For middle income earners, the principal residence is the cornerstone of net worth with housing and pensions making up nearly 80% of their total wealth, while stocks and mutual funds make up only 4% of their wealth. In the “Ultra Rich” category, though, those proportions are topsy-turvy. For those lucky folks, the principal residence makes up just 7.6% of their assets while stocks, business equity and other real estate holdings add up to almost 80% of assets. (Chart from visualcapitalist.com)
(Sources: all index return data from Yahoo Finance; Reuters, Barron’s, Wall St Journal, Bloomberg.com, ft.com, guggenheimpartners.com, zerohedge.com, ritholtz.com, markit.com, financialpost.com, Eurostat, Statistics Canada, Yahoo! Finance, stocksandnews.com, marketwatch.com, wantchinatimes.com, BBC, 361capital.com, pensionpartners.com, cnbc.com, FactSet) These are the opinions of WE Sherman and Co and not necessarily those of Cambridge, are for informational purposes only, and should not be construed or acted upon as individualized investment advice.
Securities offered through Registered Representatives of Cambridge Investment Research Inc., a broker-dealer, member FINRA/SIPC. Advisory Services offered through Cambridge Investment Research Advisors, a Registered Investment Adviser. Strategic Investment Partners and Cambridge are not affiliated.
Indices mentioned are unmanaged and cannot be invested into directly. Past performance is no guarantee of future results. All Investing involves risk. Depending on the types of investments, there may be varying degrees of risk. Investors should be prepared to bear loss, including total loss of principal.