
8-12-19 Weekly Market Update
The Very Big Picture:
The long-term valuation of the market is commonly measured by the Cyclically Adjusted Price to Earnings ratio, or “CAPE”, which smooths out shorter-term earnings swings in order to get a longer-term assessment of market valuation. A CAPE level of 30 is considered to be the upper end of the normal range, and the level at which further PE-ratio expansion comes to a halt (meaning that increases in market prices only occur in a general response to earnings increases, instead of rising “just because”). The market is currently at that level.
Of course, a “mania” could come along and drive prices higher – much higher, even – and for some years to come. Manias occur when valuation no longer seems to matter, and caution is thrown completely to the wind as buyers rush in to buy first and ask questions later. Two manias in the last century – the 1920’s “Roaring Twenties” and the 1990’s “Tech Bubble” – show that the sky is the limit when common sense is overcome by a blind desire to buy. But, of course, the piper must be paid and the following decade or two are spent in Secular Bear Markets, giving most or all of the mania gains back.
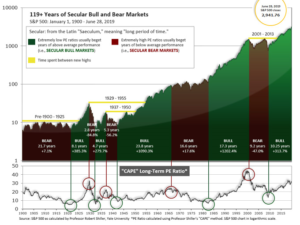
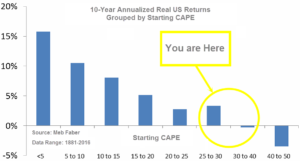
See Fig. 1 for the 100-year view of Secular Bulls and Bears. The CAPE is now at 29.53, down slightly from the prior week’s 29.66, above the level reached at the pre-crash high in October, 2007. Since 1881, the average annual return for all ten year periods that began with a CAPE around this level have been in the 0% – 3%/yr. range. (see Fig. 2).
In the Big Picture:
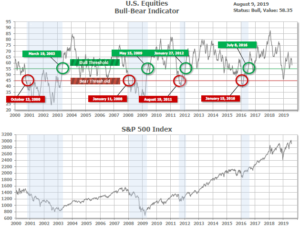
The “big picture” is the months-to-years timeframe – the timeframe in which Cyclical Bulls and Bears operate. The U.S. Bull-Bear Indicator (see Fig. 3) is in Cyclical Bull territory at 58.35, down from the prior week’s 61.13.
In the Intermediate and Shorter-term Picture:
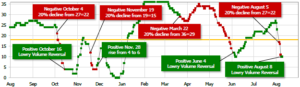
The Shorter-term (weeks to months) Indicator (see Fig. 4) turned positive on August 8th, after a short 3-day negative period. The indicator ended the week at 10, down sharply from the prior week’s 23. Separately, the Intermediate-term Quarterly Trend Indicator – based on domestic and international stock trend status at the start of each quarter – was positive entering July, indicating positive prospects for equities in the third quarter of 2019.
Timeframe summary:
In the Secular (years to decades) timeframe (Figs. 1 & 2), the long-term valuation of the market is historically too high to sustain rip-roaring multi-year returns. The Bull-Bear Indicator (months to years) remains positive (Fig. 3), indicating a potential uptrend in the longer timeframe. In the intermediate timeframe, the Quarterly Trend Indicator (months to quarters) is positive for Q3, and the shorter (weeks to months) timeframe (Fig. 4) is positive. Therefore, with three indicators positive and none negative, the U.S. equity markets are rated as Positive.
In the markets:
U.S. Markets: Growing trade tensions between the world’s two most important economies pushed markets lower for a second consecutive week. The major indexes suffered their worst day of the year at the beginning of the week as China let its currency fall below the key symbolic threshold of 7:1 yuan:dollar that has stood over the past decade. In addition, the Chicago Board Options Exchange Volatility Index (VIX) hit its highest level since late last year. But a big turnaround on Wednesday and Thursday of almost 1,000 Dow points from Wednesday’s lows gave some hope that the storm had calmed. The Dow Jones Industrial Average retreated 197 points, or -0.75%, to end the week at 26,287. The technology-heavy NASDAQ Composite fell -0.6% to 7,959. By market cap, large caps fared the best with the S&P 500 giving up just -0.5%, while the S&P midcap 400 and small cap Russell 2000 lost ‑0.7% and -1.3%, respectively.
International Markets: Canada’s TSX retraced some of last week’s decline by rising 0.4%, but other major international markets weren’t so lucky. The United Kingdom’s FTSE added to last week’s decline, falling an additional -2.1%. On Europe’s mainland, France’s CAC 40 finished down -0.6%, Germany’s DAX lost -1.5%, and Italy’s Milan FTSE gave up -3.4%. In Asia, China’s Shanghai Composite retreated -3.3%, while Japan’s Nikkei ended down -1.9%. As grouped by Morgan Stanley Capital International, developed markets finished down -1.2%, while emerging markets gave up –1.7%.
Commodities: Precious metals continued their ascent. Gold added $51, or 3.5%, to finish the week at $1508.50 an ounce, while Silver surged over 4% to $16.93 an ounce. Oil closed down for a second week, giving up -2.1% to $54.50 per barrel. The industrial metal copper, viewed by analysts as a barometer of world economic health because of its wide variety of uses, managed a 0.7% gain after two weeks of losses.
U.S. Economic News: The number of Americans seeking first-time unemployment benefits fell last week, providing further evidence that the labor market remains strong. The Labor Department reported initial jobless claims dropped by 8,000 to 209,000 last week. Economists had expected new claims would total 215,000. Analysts note that historically jobless claims are one of the first economic indicators to trigger when the economy starts to weaken. However, there’s been no sign of slippage yet even with the economy now in its eleventh year of expansion. The less volatile monthly average of new claims remained essentially flat at 212,250. The number of people already collecting unemployment benefits, known as continuing claims, declined by 15,000 to 1.68 million. Those claims remain near their lowest levels since the early 1970s.
The number of jobs available across the country fell slightly in June but remained above 7 million for the 15th straight month. The Bureau of Labor Statistics’ Job Openings and Labor Turnover Survey (“JOLTS”) reported the number of open jobs at 7.35 million in June, down slightly from 7.38 million. The record, set near the end of last year, is 7.6 million. Job openings rose in retail and real estate, while fewer jobs were available in construction, leisure, and hospitality. For the 16th consecutive month, job openings outnumbered the number of Americans unemployed. There were 1.25 million more jobs listed than the 6.1 million workers officially classified by the government as unemployed. The closely-watched “quits rate” remained unchanged at 2.5%. It’s rumored that the “quits rate” is the Federal Reserve’s “secret” indicator to gauge the health of the labor market as it is presumed an employee would only leave a job if he or she were confident of finding a more lucrative one.
The services side of the economy, which makes up about three quarters of the total, slowed last month to its lowest growth rate in almost three years. The Institute for Supply Management reported its non-manufacturing index dropped 1.4 points to 53.7—its slowest reading since August of 2016. The reading widely missed economists’ estimates for a reading of 55.5. In the details, the components that measure new orders, production, prices and backlogs all declined, while the employment gauge increased. Overall, the rate of growth in the services sector continues to weaken, though still positive (readings above 50 indicate growth). Respondents to the survey frequently cited tariffs at the top of their list of concerns. Jim O’Sullivan, chief U.S. economist at High Frequency Economics commented, “Non-manufacturing remains stronger than manufacturing, consistent with non-manufacturing being less exposed to weakening in foreign demand, but it is showing slowing nonetheless.”
Inflation at the wholesale level rose modestly last month, but remained well within the bounds watched by the Federal Reserve. Producer prices rose 0.2% in July after ticking up 0.1% in June. Over the past 12 months, the PPI increased 1.7%. Economists polled by Reuters had forecast the PPI would rise 0.2% in July and increase 1.7% on a year-on-year basis. Excluding the volatile food, energy, and trade services components, producer prices actually ticked down -0.1% last month, the first decline since October 2015. Over the past 12 months, the so-called core PPI increased 1.7%. The Fed, which has a 2% inflation target, tracks the core personal consumption expenditures (PCE) price index for monetary policy. The core PCE price index increased 1.6% on a year-on-year basis in June and has undershot its target this year. The inflationary effects of tariffs predicted by so many have yet to materialize.
International Economic News: Economists aren’t budging in their prediction that Bank of Canada Governor Stephen Poloz will hold interest rates steady for at least another year. Despite renewed speculation about an impending global recession and many central banks already embarking on an easing policy, a Bloomberg survey showed a majority of economists still expect Poloz to hold Canada’s benchmark overnight rate at 1.75% until the end of 2020. Their confidence seems to come from the surprising robustness of the domestic Canadian economy. As global trade uncertainty continues to mount, key economic indicators still continue to meet or exceed expectations—including back-to-back monthly trade surpluses. Of the 15 economists surveyed by Bloomberg, nine expect the Bank of Canada to remain on hold to the end of 2020. Major Canadian domestic banks are among the more optimistic — with Toronto Dominion, Bank of Montreal, Scotiabank, National Bank and Laurentian expecting Poloz to hold well into next year.
Across the Atlantic, for the first time in almost 7 years the United Kingdom’s economy fell into contraction. The UK’s Office for National Statistics reported output fell -0.2% in the second quarter, worse than the flat performance expected by economists and down -0.5% from the first quarter. Britain’s economy had not contracted since the end of 2012. Analysts noted that the decline was caused by a combination of slowing stockpiling activity by UK manufacturers ahead of Brexit, continued uncertainty surrounding Brexit negotiations, and weaker global growth. Sajid Javid, Chancellor of the Exchequer, pointed the finger at broader economic weakness across the globe, saying this has been a “challenging period across the global economy, with growth slowing in many countries.”
Industrial production in France fell sharply in June. French statistics agency Insee reported industrial production dropped -2.3% from May, undermining hopes that the Eurozone’s manufacturing sector might be improving. Manufacturing fell -2.2% in June and was down -0.3% in the second quarter. The readings reflect the challenges that face French President Emmanuel Macron as he seeks to boost French economic growth and reduce the budget deficit. Billions of euros of tax cuts and benefits have failed to stimulate household consumption.
Manufacturing activity in the Eurozone’s economic powerhouse Germany dropped in June prompting warnings that escalating trade tensions between the U.S. and China could push the country into recession. Germany’s statistics office Destatis reported industrial production dropped -1.5% in June and is now down -5.2% from the same time last year. Carsten Brzeski, chief economist for Germany at ING stated the figures are “devastating, with no silver lining” and threaten the country’s status as Europe’s most reliable economic engine. Brzeski said the slowdown was the result of factors including the absence of domestic economic reforms in Germany and a weaker-performing Eurozone economy overall.
In Asia, China reported trade data that was better than expected, given the mounting economic pressure from rising U.S. tariffs. China reported its U.S. dollar-denominated exports rose 3.3% in July from the same time last year, while imports fell 5.6% during the same period. The country’s overall trade surplus last month was $45.06 billion, according to customs data. China’s trade surplus with the U.S. (more than half of the total surplus) was $27.97 billion in July, lower than the previous month’s $29.92 billion. From January to July, China’s trade surplus with the U.S. has totaled $168.5 billion. Lu Yu, a portfolio manager at Allianz Global Investors, said a weaker Chinese yuan versus the U.S. dollar and other currencies has helped Chinese manufacturers to sell their goods overseas, and has overcome the effects of US tariffs by absorbing the tariffs through currency depreciation. The depreciating yuan “is helping the exporters in China to export not just to the U.S. because it dampens the impact of the tariff hike, but also help them to export to other countries,” Ms. Yu stated.
Japan’s economy grew at a faster-than-expected pace in the second quarter, according to government data. The world’s third-biggest economy grew 0.4% from the first quarter, Japan’s Cabinet Office said, beating analysts’ median forecast of 0.1%. The third straight period of expansion will also bolster Prime Minister Shinzo Abe’s determination to push through a controversial sales tax hike in October despite warnings it could weigh on growth. Shoppers are rushing to make purchases before the rate rises from 8% to 10% on October 1 and this boost for consumption also helped push GDP higher, economists said. The national 10-day holiday for the enthronement of Emperor Naruhito also propped up consumer sales figures, analysts noted.
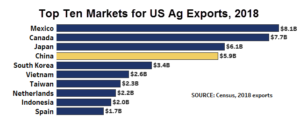
Finally: Market turmoil this week was caused in large part by President Trump’s additional tariff announcement, followed quickly by China’s announcement that it was officially terminating all purchases of US agricultural products. The loss of sales to China was called “devastating”, “crippling”, and “a very big deal” by agricultural experts. So how big is the Chinese market for US ag exports? Big, but surprisingly not the biggest, or even second biggest – it is (or was!) the fourth largest market for US ag exports last year, as shown in this chart from CNBC.
(Sources: all index return data from Yahoo Finance; Reuters, Barron’s, Wall St Journal, Bloomberg.com, ft.com, guggenheimpartners.com, zerohedge.com, ritholtz.com, markit.com, financialpost.com, Eurostat, Statistics Canada, Yahoo! Finance, stocksandnews.com, marketwatch.com, wantchinatimes.com, BBC, 361capital.com, pensionpartners.com, cnbc.com, FactSet) These are the opinions of WE Sherman and Co and not necessarily those of Cambridge, are for informational purposes only, and should not be construed or acted upon as individualized investment advice.
Securities offered through Registered Representatives of Cambridge Investment Research Inc., a broker-dealer, member FINRA/SIPC. Advisory Services offered through Cambridge Investment Research Advisors, a Registered Investment Adviser. Strategic Investment Partners and Cambridge are not affiliated.
Indices mentioned are unmanaged and cannot be invested into directly. Past performance is no guarantee of future results. All Investing involves risk. Depending on the types of investments, there may be varying degrees of risk. Investors should be prepared to bear loss, including total loss of principal.