
7-25-2022 Weekly Market Update
The very Big Picture
The long-term valuation of the market is commonly measured by the Cyclically Adjusted Price to Earnings ratio, or “CAPE”, which smooths-out shorter-term earnings swings in order to get a longer-term assessment of market valuation. A CAPE level of 30 is considered to be the upper end of the normal range, and the level at which further PE-ratio expansion comes to a halt (meaning that further increases in market prices only occur as a general response to earnings increases, instead of rising “just because”). The market is now above that level.
Of course, a “mania” could come along and drive prices higher – much higher, even – and for some years to come. Manias occur when valuation no longer seems to matter, and caution is thrown completely to the wind – as buyers rush in to buy first, and ask questions later. Two manias in the last century – the “Roaring Twenties” of the 1920s, and the “Tech Bubble” of the late 1990s – show that the sky is the limit when common sense is overcome by a blind desire to buy. But, of course, the piper must be paid, and the following decade or two were spent in Secular Bear Markets, giving most or all of the mania-gains back.
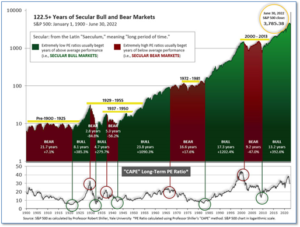
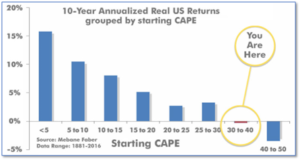
See Fig. 1 for the 100-year view of Secular Bulls and Bears. The CAPE is now at 29.72, up from the prior week’s 28.98. Since 1881, the average annual return for all ten-year periods that began with a CAPE in this range has been slightly positive to slightly negative (see Fig. 2)
Note: We do not use CAPE as an official input into our methods. However, if history is any guide – and history is typically ‘some’ kind of guide – it’s always good to simply know where we are on the historic continuum, where that may lead, and what sort of expectations one may wish to hold in order to craft an investment strategy that works in any market ‘season’ … whether the current one, or one that may be ‘coming soon’!
The Big Picture:
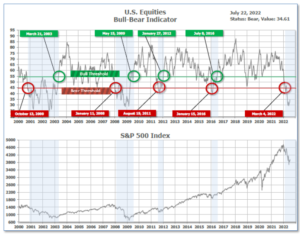
The ‘big picture’ is the (typically) years-long timeframe – the timeframe in which Cyclical Bulls and Bears operate. The U.S. Bull-Bear Indicator finished the week in Bear territory at 34.61, up from the prior week’s 32.27.
In the Quarterly- and Shorter-term Pictures
The Quarterly-Trend Indicator based on the combination of U.S. and International Equities trend-statuses at the start of each quarter – was Negative entering July, indicating negative prospects for equities in the third quarter of 2022.
Next, the short-term(weeks to months) Indicator for US Equities turned positive on June 24, and ended the week at 31, up from the prior week’s 13.
In the Markets:
U.S. Markets: Equity markets carried over their momentum from the end of last week as investors welcomed signs of fading inflationary pressures and decent corporate earnings. Small-cap stocks and the technology-heavy NASDAQ Composite outperformed the other indices. The Dow Jones Industrial Average added 611 points finishing the week at 31,899—a gain of 2%. The NASDAQ retraced all of last week’s decline and then some closing up 3.3% to 11,834. By market cap, the large cap S&P 500 gained 2.5%, while the mid cap S&P 400 rallied 4% and the small cap Russell 2000 ended the week up 3.6%.
International Markets: International markets were all green as well. Canada’s TSX rose 3.2%, while the United Kingdom’s FTSE 100 added 1.6%. On Europe’s mainland, France’s CAC 40 and Germany’s DAX each gained 3%, while in Asia, China’s Shanghai Composite added 1.3%. Japan’s Nikkei rallied 4.2%–its third consecutive week of gains. As grouped by Morgan Stanley Capital International, emerging markets finished the week up 2% and developed markets closed up 3.3%.
Commodities: Commodities were predominantly to the upside, too – with a slight twist. Precious metals rose with Gold adding 1.4% to $1727.40 per ounce, while Silver added 0.1% to $18.62. The industrial metal Copper, which has plunged over the last six weeks, managed to rebound 3.6%. Copper is often seen as a good indicator of future economic growth due to its wide variety of industrial and residential uses. The oil market had a rare divergence between the two major oil benchmarks: West Texas Intermediate crude oil closed down -3% to $94.70 per barrel, while Brent crude gained 2.4% to $103.60.
U.S. Economic News: The U.S. labor market remains resilient despite some deteriorating economic reports, but is losing some of its luster. The number of Americans filing for first time unemployment benefits jumped by 7,000 to 251,000 last week, the Labor Department reported. Economists had expected new claims would tick down by 4,000 to 244,000. Claims have steadily risen since hitting a low of 166,000 in March—the lowest level of claims since 1968. Meanwhile, the number of people already collecting jobless benefits rose by 51,000 to 1.38 million. That number remains near historic lows.
Sales of existing homes fell by 5.4% to a seasonally-adjusted annual rate of 5.12 million in June, the National Association of Realtors (NAR) reported. The reading missed economists’ expectations for a reading of 5.36 million. This is the weakest level of sales since June 2020, shortly after the beginning of COVID lockdowns. Compared with the same time last year, home sales were down 14.2%. The median price for an existing home rose to a record $416,000 up 13.4% from June 2021. Expressed in terms of the months-supply metric, there was a 3-month supply of homes for sale in June, up from 2.6 months in May. Before the pandemic, a four-month supply was more the norm. Lawrence Yun, chief economist at the NAR, stated the drop in existing home sales was “clearly due to the plunging affordability” primarily driven by higher home prices and mortgage rates.
The news from homebuilders mirrored the report from realtors. Confidence among the nation’s home builders plunged in July, its second-largest drop in the history of the National Association of Home Builders (NAHB) survey. The NAHB reported its homebuilder confidence index fell 12 points to 55, its seventh consecutive monthly decline. The decline was much larger than expected. Economists had expected a reading of 66. One year ago, the index stood at 80—the latest reading is its lowest since May of 2020. All three gauges that make up the index declined. The measure that tracks current sales conditions fell by 12 points, while the component that measures prospective buyer traffic fell by 11. The gauge that assesses sales expectations for the next six months also fell 11 points. Builder confidence was weak across the entire country. In the Northeast confidence fell by 6 points; in the Midwest by 4; in the South by 8; and the West by 12. NAHB Chairman Jerry Konter, a builder in Savannah, Georgia stated, “Production bottlenecks, rising home building costs and high inflation are causing many builders to halt construction because the cost of land, construction and financing exceeds the market value of the home.”
Construction of new homes fell a seasonally-adjusted 2% in June to an annual rate of 1.56 million, the Commerce Department reported. On annual basis, total housing starts fell 6.3% from the previous year. Economists had expected housing starts to rise to a 1.59 million rate from June’s initial estimate of 1.55 million. Richard Moody, chief economist at Regions Financial noted even though demand for homes in the U.S. is cooling, “builders will remain busy for some time working down backlogs of unfilled orders, even allowing for rising cancellations.” But the drop in housing starts, which follows weak sentiment expressed by homebuilders in July, hints at further gloominess in the housing sector.
A preliminary ‘flash’ reading of the vast services side of the U.S. economy showed a “worrying deterioration”. S&P Global Market Intelligence reported its U.S. services Purchasing Managers’ Index (PMI) fell to a 26-month low of 47 in July, from 51.6 in the prior month. Readings below 50 signify contraction. Also in the report, the manufacturing flash PMI slid to 52.3 from 52.7. That was the weakest level in two years as well. Chris Williamson, chief business economist at S&P Global Market Intelligence stated, “The preliminary PMI data for July point to a worrying deterioration in the economy. Manufacturing has stalled and the service sector’s rebound from the pandemic has gone into reverse, as the tailwind of pent-up demand has been overcome by the rising cost of living, higher interest rates and growing gloom about the economic outlook.”
International Economic News: There’s been a lot of talk about the dreaded “R-word” globally, but according to two Scotiabank economists those worries are overblown, for Canada at least. Jean-Francois Perrault and Rene Lalonde wrote “record levels of pent-up demand are expected to keep household consumption spending elevated despite rising interest rates, low consumer confidence, decades-high inflation, and weaker financial markets.” “This pent-up demand is expected to keep the Canadian economy from going into recession.” In the report, they’ve been closely monitoring discretionary spending data such as dining out. “This type of spending is usually the first to be foregone when households watch their expenses,” the economists wrote, pointing to food and travel. In fact, diner numbers were 20% above 2019 levels as of July 16 this year.
Across the Atlantic, the United Kingdom’s economy is forecast to grow 3.7% this year and 1.0% in 2023, according to the latest EY Item Club data. The new forecast is a downgrade from May’s 4.1% and 1.9% expectations. The downward revisions come thanks to the continued squeeze on households’ real incomes from higher inflation, supply chain disruptions, and interest rate hikes. According to the report, Britain is expected to narrowly avoid a recession provided there are no further energy price shocks and the Bank of England does not tighten monetary policy too quickly. “The outlook for the UK economy has become substantially gloomier than it was in the spring, but – while there are significant risks – the forecast suggests there should still be enough support to help the economy eke out growth over the rest of the year and avoid a recession,” Hywel Ball, EY UK chair, said.
On Europe’s mainland, Russia’s Gazprom resumed gas flows to Germany after maintenance on the Nord Stream pipeline. Natural gas began flowing again through the key pipeline equivalent to levels before the gas was turned off to accommodate 10 days of work on the pipeline under the Baltic Sea. Despite a rush to wean itself off Russian gas, Germany still depends on Russia for about a third of its gas supply. Economy and Climate Minister Robert Habeck said Germany needs to be prepared for gas flows to be reduced in the future. “Putin aims to rattle us, drive up prices, divide society and weaken the support for Ukraine,” he said.
In Asia, ADB, the Asian Development Bank, cut its growth forecast for China due to concerns over the country’s zero-Covid approach and strict lockdowns. Gross Domestic Product is expected to be at 4% in 2022, down from an earlier estimate of 5%, ADB said in a report. China’s continued “adherence to a zero-covid strategy in response to renewed outbreaks early in 2022 has triggered the reimposition of strict lockdowns,” the bank said in its report. “With many economies in the region increasingly choosing to live with the virus and reopening, economic activity continued to expand in the first half of 2022–with the notable exception” of China, the bank added. President Xi Jinping pledged last month to use “more forceful” measures to achieve the country’s economic targets for the year.
The Bank of Japan raised its inflation forecast this week, but retained its aggressive monetary easing policy, ensuring it will remain a global outlier as other top economies raise interest rates in the face of soaring global inflation. In its quarterly outlook, the BOJ bumped up its inflation forecast for fiscal 2022 from 1.9% to 2.3%, while revising down Japan’s real gross domestic product growth forecast from 2.9% to 2.4%. The decision by the central bank to keep its policy unchanged was widely expected among economists. Kuroda reiterated that Japan needs aggressive monetary easing to support economic recovery while aiming to realize 2% inflation in a stable and sustainable manner.
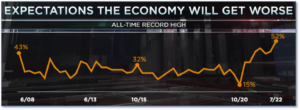
Finally: If there’s one thing that’s able to doom the future of an incumbent President – even more than scandal – it is Inflation. President Joe Biden’s overall and economic approval numbers have reached the lowest levels of his presidency and fallen further than that of either of his two predecessors. The CNBC All-America Economic Survey reported Biden’s economic approval dropped to just 30%. Even more, CNBC said the economic outlook of survey respondents was the worst in the 15-year history of the survey. Of the respondents, 52% believe the economy will get worse over the next year, while just 22% believe it will improve. The current readings exceed those at the height of the Great Financial Crisis of 2008 and the depths of the COVID pandemic. (Chart from CNBC.com)
(Sources: All index- and returns-data from Yahoo Finance; news from Reuters, Barron’s, Wall St. Journal, Bloomberg.com, ft.com, guggenheimpartners.com, zerohedge.com, ritholtz.com, markit.com, financialpost.com, Eurostat,0020Statistics Canada, Yahoo! Finance, stocksandnews.com, marketwatch.com, wantchinatimes.com, BBC, 361capital.com, pensionpartners.com, cnbc.com, FactSet.) Content provided by WE Sherman and Company. Securities offered through Registered Representatives of Cambridge Investment Research Inc., a broker-dealer, member FINRA/SIPC. Advisory Services offered through Cambridge Investment Research Advisors, a Registered Investment Adviser. Strategic Investment Partners and Cambridge are not affiliated. Indices mentioned are unmanaged and cannot be invested into directly. Past performance is no guarantee of future results.