
7-8-19 Weekly Market Update
The very Big Picture:
The long-term valuation of the market is commonly measured by the Cyclically Adjusted Price to Earnings ratio, or “CAPE”, which smooths out shorter-term earnings swings in order to get a longer-term assessment of market valuation. A CAPE level of 30 is considered to be the upper end of the normal range, and the level at which further PE-ratio expansion comes to a halt (meaning that increases in market prices only occur in a general response to earnings increases, instead of rising “just because”). The market is currently at that level.
Of course, a “mania” could come along and drive prices higher – much higher, even – and for some years to come. Manias occur when valuation no longer seems to matter, and caution is thrown completely to the wind as buyers rush in to buy first and ask questions later. Two manias in the last century – the 1920’s “Roaring Twenties” and the 1990’s “Tech Bubble” – show that the sky is the limit when common sense is overcome by a blind desire to buy. But, of course, the piper must be paid and the following decade or two are spent in Secular Bear Markets, giving most or all of the mania gains back.
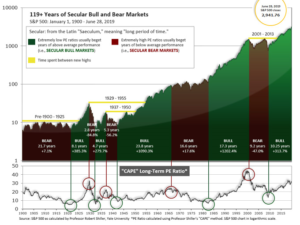
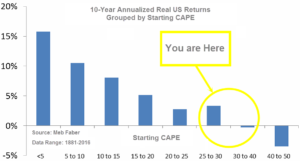
See Fig. 1 for the 100-year view of Secular Bulls and Bears. The CAPE is now at 30.50, up from the prior week’s 29.99, above the level reached at the pre-crash high in October, 2007. Since 1881, the average annual return for all ten year periods that began with a CAPE around this level have been in the 0% – 3%/yr. range. (see Fig. 2).
In the Big Picture:
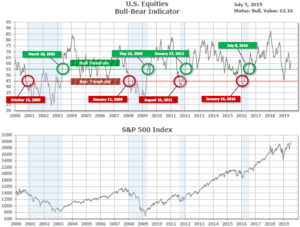
The “big picture” is the months-to-years timeframe – the timeframe in which Cyclical Bulls and Bears operate. The U.S. Bull-Bear Indicator (see Fig. 3) is in Cyclical Bull territory at 62.16, up from the prior week’s 60.10.
In the intermediate and Shorter-term picture:
The Shorter-term (weeks to months) Indicator (see Fig. 4) turned positive on June 4th. The indicator ended the week at 22, up from the prior week’s 19. Separately, the Intermediate-term Quarterly Trend Indicator – based on domestic and international stock trend status at the start of each quarter – was positive entering July, indicating positive prospects for equities in the third quarter of 2019.

Timeframe summary:
In the Secular (years to decades) timeframe (Figs. 1 & 2), the long-term valuation of the market is historically too high to sustain rip-roaring multi-year returns. The Bull-Bear Indicator (months to years) remains positive (Fig. 3), indicating a potential uptrend in the longer timeframe. In the intermediate timeframe, the Quarterly Trend Indicator (months to quarters) is positive for Q3, and the shorter (weeks to months) timeframe (Fig. 4) is positive. Therefore, with three indicators positive and none negative, the U.S. equity markets are rated as Positive.
In the markets:
U.S. Markets: The major U.S. indexes ended the week in the green with several hitting new highs during the week. The Dow Jones Industrial Average rose 1.2%, or 322 points, to close at 26,922. The technology-heavy NASDAQ Composite rose 1.9% ending the week at 8,161. By market cap, the large cap S&P 500 rallied 1.7%, while the S&P 400 mid cap index added 1.1% and the small cap Russell 2000 brought up the rear with a gain of 0.6%.
International Markets: Canada’s TSX retraced last week’s decline by closing up 1.0%. Across the Atlantic, the United Kingdom’s FTSE gained 1.7% – its fifth consecutive weekly gain. On Europe’s mainland, France’s CAC 40 rose 1.0%, Germany DAX gained 1.4%, and Italy’s Milan FTSE added 3.5%. In Asia, China’s Shanghai Composite rebounded 1.1% and Japan’s Nikkei finished up 2.2%. As grouped by Morgan Stanley Capital International, developed markets managed a 0.7% gain, while emerging markets ticked up just 0.1%.
Commodities: Precious metals finished down, dropping at the end of the week in response to the surprisingly-strong U.S. jobs numbers. Gold retreated $13.60 to $1400.10, a decline of 1.0%. Likewise, Silver finished the week down -2.2% to $15.00 an ounce. Oil had its first down week in three, retreating -1.6% to $57.51 per barrel. The industrial metal copper, viewed by analysts as a barometer of global economic health due to its variety of industrial uses, retreated -1.1%.
U.S. Economic News: The number of people applying for first-time unemployment benefits fell by 8,000 to 221,000 last week, remaining near their lowest levels in 50 years. The reading bested economists’ forecasts of claims dropping to 223,000. The more stable monthly average rose by 500 to 222,250. Jobless claims remain well-below the 300,000-threshold analysts use to indicate a “healthy” jobs market. Analysts note hiring has slowed during the first half of 2019, but there’s been no indication that companies are cutting jobs. Continuing claims, which counts the number of Americans already receiving benefits, also fell 8,000 to 1.69 million. That number is reported with a one-week delay.
The Labor Department’s monthly Non-Farm Payrolls (NFP) report showed the U.S. added 224,000 jobs in June as worries about the economy dissipated and hiring rebounded. The increase in new jobs easily beat the consensus forecast for 170,000 new jobs. The improved hiring last month dispels (at least for now) the threat of a dramatic slowdown in economic growth. Escalating trade disputes and a slowing global economy have weighed on exports an undermined the confidence of consumers and businesses. Supporting the prospect of continued economic growth, the U.S. and China agreed last week to delay pending tariffs and return to negotiations. Paradoxically, the NFP also showed the unemployment rate ticking up to 3.7% from 3.6%, but it was because more than 300,000 people came off the sidelines and entered the labor force in search of work. Still, the unemployment rate remains near a 50-year low.
Manufacturing activity in the United States grew at its slowest pace in more than two years as global trade tensions continued to rise. The Institute for Supply Management (ISM) reported its manufacturing index fell 0.4 point to 51.7 last month. The index hit a 14-year high of 60.8 last August but has steadily declined since. Despite the decline, the reading still managed to exceed economists’ forecasts of 51.3. In the details, customer orders were flat – its weakest reading since late 2015 – while inventories contracted. Exports managed a slight gain. The index is compiled from a survey of executives who order raw materials and other supplies for their companies. Some analysts noted that the survey was conducted during a tense period with China and Mexico. Thomas Simons, senior money market economist at Jefferies LLC stated, “Relations with both China and Mexico have improved since this survey data was collected, so next month should be better”.
ISM also reported that the much larger services side of the economy grew last month at its slowest pace in almost two years. ISM’s index of service-oriented companies such as banks, restaurants and hospitals slipped 1.8 points to 55.1 last month, matching its lowest reading since summer of 2017. While numbers over 50 are still viewed as positive for the economy, the index has trended lower since hitting a high of 60 less than a year ago. In the details, the sub-index for business production dropped 3 points to 58.2, while new orders declined 2.8 points to 55.8 and employment fell 3.1 points to 55. Altogether it was still good news, as 16 of the 17 industries tracked by ISM said their businesses were expanding. The only one to contract was the arts and entertainment industry.
The Commerce Department reported that the U.S. trade deficit surged 8.4% in May, hitting its highest level of the year. The trade deficit rose $4.3 billion to $55.5 billion. Economists had forecast a deficit of $54.4 billion. In the details, U.S. exports rose 2% to $210.6 billion as the U.S. shipped more soybeans, planes, autos and networking equipment. However, imports increased a larger 3.3% to $266.2 billion as the U.S. imported more foreign autos, oil, semiconductors, computers and cell phones. The trade gap with China rose slightly in May to $31.1 billion, but that number is running behind last year’s pace due to U.S. tariffs. Overall, the U.S. is still on track to record a larger annual trade deficit in 2019 than last year because trade gaps have expanded with other key partners like Mexico, Europe and Canada.
International Economic News: Canada’s labor market slowed last month as the unemployment rate ticked up slightly from historic lows. Statistics Canada reported the economy shed 2,200 jobs last month, missing expectations for a gain of about 10,000. The unemployment rate ticked up to 5.5% after hitting a four-decade low of 5.4% in May. Despite the reading, the first half of the year was still one of the best on record in terms of job gains. Avery Shenfield, chief economist at Canadian Imperial Bank of Commerce wrote in a note, “We’ll forgive Canada’s job market for taking an early summer holiday in terms of employment gains, given the massive surge in hiring that preceded it.” Canada’s economy added 247,500 jobs since the end of last year—the bulk of them full-time. In addition, wage gains accelerated at their fastest pace in more than a year.
France’s main business lobbying group said the current global trade war was “extremely worrying” and could reverse years of higher living standards. MEDEF President Geoffrey Roux de Bezieux stated free trade had created “enormous wealth” and had taken “hundreds of millions out of poverty.” However the current so-called ‘economic cold war’ was “extremely worrying for us”, he said.
German factory orders sank far more than expected in May adding to concerns over the health of the global economy. Manufacturing orders in Germany dropped 2.2% from the previous month in May and were down over 8.5% from the same time last year, according to the German statistics agency Destatis. A steep drop in foreign demand is hitting manufacturers across the Eurozone, with Germany’s 1.6 trillion euro export industries being hit particularly hard. “Today’s figures do not bode well for the short-term prospects for the German economy,” said Ralph Solveen, an economist at Commerzbank, who added that the report underlines “our expectation that the German economy shrank in the second quarter and that hopes of a noticeable improvement in the third are dwindling”.
Chinese Premier Li Keqiang pledged that Beijing will push to create an equal playing field in the country for all companies. “Right now we need to let state-owned enterprises, privately owned enterprises and foreign-invested companies, as long as they are registered in China, to be recognized as Chinese companies, all treated equally,” Li said in his address at the World Economic Forum in Dalian, China. American and other foreign companies have long complained that the Chinese government gives preferential treatment to home-grown businesses, especially its state-owned corporations. Despite repeated assurances to open up its economy to outside investment, Beijing has often required foreign companies to form joint ventures with Chinese entities—and many have reported being coerced into sharing valuable technology in order to operate in the country.
Household spending in Japan rose the most in 4 years in May, a sign that improving domestic demand should offer support for an economy facing growing external pressure. Household spending grew 4% in May from a year earlier, government data showed. The increase was the fastest since May 2015 and far exceeded the median forecast of a 1.6% increase. The Bank of Japan has been counting on an improvement in consumer spending to achieve its elusive 2-percent inflation target, having failed at its attempts to drive up consumer prices with years of heavy money printing. In addition to the improvement in spending, Japan’s coincident indicator index, which consists of a range of data including factory output, employment and retail sales, rose for the second month in May.
Finally: The dream of instant riches has enticed millions of investors to take a flyer on Initial Public Offerings (IPOs). Everyone knows that early investors in Apple, Google, Microsoft and others have been richly rewarded. But, unfortunately, for every one of those huge winners, there are hundreds of huge losers. Professor Jay Ritter at the University of Florida calculated the returns from thousands of IPOs over their first 5 years of existence as public corporations. He found that, 5 years after their IPO date, more than 60% were selling BELOW their first-day closing price, and more than 40% were selling at less than half their first-day closing price. And the huge winners of stock market lore? About 1.1% of the IPOs he studied were selling at levels 10 or more times above their first-day closing price. (Chart from cnbc.com)

(Sources: all index return data from Yahoo Finance; Reuters, Barron’s, Wall St Journal, Bloomberg.com, ft.com, guggenheimpartners.com, zerohedge.com, ritholtz.com, markit.com, financialpost.com, Eurostat, Statistics Canada, Yahoo! Finance, stocksandnews.com, marketwatch.com, wantchinatimes.com, BBC, 361capital.com, pensionpartners.com, cnbc.com, FactSet) These are the opinions of WE Sherman and Co and not necessarily those of Cambridge, are for informational purposes only, and should not be construed or acted upon as individualized investment advice.
Securities offered through Registered Representatives of Cambridge Investment Research Inc., a broker-dealer, member FINRA/SIPC. Advisory Services offered through Cambridge Investment Research Advisors, a Registered Investment Adviser. Strategic Investment Partners and Cambridge are not affiliated.
Indices mentioned are unmanaged and cannot be invested into directly. Past performance is no guarantee of future results. All Investing involves risk. Depending on the types of investments, there may be varying degrees of risk. Investors should be prepared to bear loss, including total loss of principal.