
7-15-19 Weekly Market Update
The Very Big Picture:
The long-term valuation of the market is commonly measured by the Cyclically Adjusted Price to Earnings ratio, or “CAPE”, which smooths out shorter-term earnings swings in order to get a longer-term assessment of market valuation. A CAPE level of 30 is considered to be the upper end of the normal range, and the level at which further PE-ratio expansion comes to a halt (meaning that increases in market prices only occur in a general response to earnings increases, instead of rising “just because”). The market is currently at that level.
Of course, a “mania” could come along and drive prices higher – much higher, even – and for some years to come. Manias occur when valuation no longer seems to matter, and caution is thrown completely to the wind as buyers rush in to buy first and ask questions later. Two manias in the last century – the 1920’s “Roaring Twenties” and the 1990’s “Tech Bubble” – show that the sky is the limit when common sense is overcome by a blind desire to buy. But, of course, the piper must be paid and the following decade or two are spent in Secular Bear Markets, giving most or all of the mania gains back.
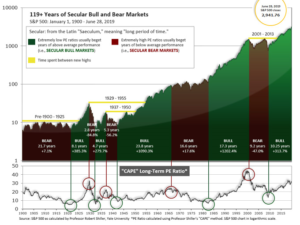
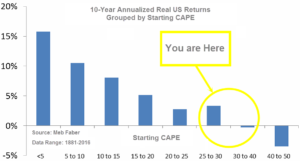
See Fig. 1 for the 100-year view of Secular Bulls and Bears. The CAPE is now at 30.73, up from the prior week’s 30.50, above the level reached at the pre-crash high in October, 2007. Since 1881, the average annual return for all ten year periods that began with a CAPE around this level have been in the 0% – 3%/yr. range. (see Fig. 2).
In the Big Picture:
The “big picture” is the months-to-years timeframe – the timeframe in which Cyclical Bulls and Bears operate. The U.S. Bull-Bear Indicator (see Fig. 3) is in Cyclical Bull territory at 64.25, up from the prior week’s 62.16.

In the intermediate and Shorter-term picture:
The Shorter-term (weeks to months) Indicator (see Fig. 4) turned positive on June 4th. The indicator ended the week at 22, unchanged from the prior week. Separately, the Intermediate-term Quarterly Trend Indicator – based on domestic and international stock trend status at the start of each quarter – was positive entering July, indicating positive prospects for equities in the third quarter of 2019.

Timeframe Summary:
In the Secular (years to decades) timeframe (Figs. 1 & 2), the long-term valuation of the market is historically too high to sustain rip-roaring multi-year returns. The Bull-Bear Indicator (months to years) remains positive (Fig. 3), indicating a potential uptrend in the longer timeframe. In the intermediate timeframe, the Quarterly Trend Indicator (months to quarters) is positive for Q3, and the shorter (weeks to months) timeframe (Fig. 4) is positive. Therefore, with three indicators positive and none negative, the U.S. equity markets are rated as Positive.
In the Markets:
U.S. Markets: The major U.S. indexes ended the week mixed even as large-cap benchmarks hit new highs. The large-cap S&P 500 and the Dow Jones Industrial Average each hit new record highs this week, while the technology-heavy NASDAQ composite also performed well. The smaller cap indexes, though, recorded modest losses for the week. The Dow Jones Industrial Average rallied over 400 points to close at 27,332, a gain of 1.5%. The NASDAQ added 82 points, or 1.0%, finishing at 8,244. The large cap S&P 500 gained 0.8%, while the mid cap S&P 400 retreated ‑0.3% and the Russell 2000 finished down ‑0.4%.
International Markets: Unlike the Dow Jones Industrials and the S&P 500, most international indexes finished lower for the week. Canada’s TSX finished down a third of a percent while the United Kingdom’s FTSE was off ‑0.6%. On Europe’s mainland, France’s CAC 40 fell -0.4%, Germany’s DAX lost -2.0% and Italy’s Milan FTSE gained 0.9%. In Asia, China’s Shanghai Composite retreated -2.7%, while Japan’s Nikkei ended down -0.3%. As grouped by Morgan Stanley Capital International, developed markets finished down -0.6% while emerging markets fell -0.2%.
Commodities: Gold recovered last week’s loss by adding $12.10, or 0.9%, to close $1412.20 an ounce. Silver added 1.6% finishing the week at $15.24 an ounce. Crude oil rallied 4.7% to close at $60.21 per barrel of West Texas Intermediate while the industrial metal copper, seen by analysts as a barometer of global economic health due to its wide variety of uses, added 1.2%.
U.S. Economic News: The number of people applying for first time unemployment benefits fell last week to its lowest level in more than three months. The Labor Department reported initial jobless claims fell by 13,000 to 209,000 last week. Economists had estimated new claims would total 221,000. The less-volatile monthly average of new claims also declined, falling 3,250 to 219,250. The number of claims remains well-below the key 300,000 threshold that analysts use to indicate a “healthy” jobs market. Thomas Simons, senior money market economist at Jefferies LLC stated, “The labor market remains very tight, layoff activity is low, and there is no evidence in the economic data that suggests that these conditions will change any time soon.”
The Labor Department’s Job Opening and Labor Turnover Survey (JOLTS) report showed job openings in the U.S. fell slightly to 7.32 million in May, but remained near record highs. Companies hired 5.73 million people in May, down from 6 million in the prior month. The decline in hiring wasn’t a surprise as the U.S. only added 72,000 new jobs that month according to its monthly employment figures. In the JOLTS details, hiring has slowed in manufacturing and other export-heavy industries due to ongoing trade tensions and a weaker global economy. The much larger services side of the economy is still seeing strong growth, however. For the 15th consecutive month, job openings outnumbered the unemployed – there were 1.3 million more job openings than the number of people officially classified as unemployed.
Americans paid more for rent, clothes, and cars last month, but overall inflation was largely held in check by falling energy prices. The Bureau of Labor Statistics reported the consumer price index rose 0.1% in June whereas economists had forecast no change. Over the past 12 months, the cost of living slipped 0.2% to a four-month low of 1.6%. Core inflation, which strips out food and energy, rose 0.3% last month—its biggest increase in a year and a half. From the same time last year, core inflation ticked up 0.1% to 2.1%. Inflation has eased in 2019 to a 2% rate or less, confounding predictions that a tight labor market and record economic expansion would generate higher prices.
At the producer level, prices rose a modest 0.1% in June, indicating that inflation remains under control at the wholesale level, too. Prices at the wholesale level were up 1.7% over the past 12 months, its lowest rate in more than two years. Excluding food, energy, and trade margins, the “core PPI” was flat last month after two consecutive months of 0.4% gains. The annual rate of increase in core prices declined 0.2% to 2.1%. Within the main subcomponents, prices for goods fell 0.4%, the most since January. However, more than 60% of the drop can be traced to a 5% decline in gasoline prices, the government said. A notable exception: the price of corn surged 19.9% due to the difficult growing conditions—its biggest increase in almost 4 years.
Sentiment among the nation’s small business owners dipped in June predominantly due to “uncertainty” surrounding the slowdown in global trade and May’s stock market tumble. The National Federation of Independent Business (NFIB) small-business optimism index declined 1.7 points to 103.3—missing the consensus forecast of 104.0. In the details, six of the ten components fell, while three improved and one stayed the same. Owners’ plans to increase employment and to spend on capital equipment both declined, as well as expectations of higher sales in the future. In its statement, the NFIB noted increased costs due to tariffs may soon be passed on to customers. “Some tariff inflation pressures may be surfacing as the percent of firms raising selling prices rose significantly, with 30% of owners reporting recent changes in China trade policy negatively impacting their business,” the group said in its release.
Minutes from the Federal Reserve’s June meeting supported views that the central bank is prepared to cut interest rates at their meeting at the end of July. According to the summary of last month’s discussions, “many” Federal Reserve officials said they would be willing to cut interest rates if risks and uncertainties “continued to weigh on the economic outlook.” And that is exactly how the economy has performed, according to Fed Chairman Jerome Powell, in testimony before Congress this week. In testimony, Chairman Powell stated the economy has not picked up since the last Fed meeting and repeated that the Fed is ready to act to support demand. The minutes revealed that Powell has the backing of most Fed officials for a move.
International Economic News: The Bank of Canada held its key overnight interest rate steady, citing an uncertain outlook clouded by trade tensions. The decision this week kept the interest at 1.75% for a sixth consecutive meeting as Canada rebounds from a weak stretch that almost brought the economy to a standstill in late 2018 and early 2019. Bank of Canada Governor Stephen Poloz appeared to be in no rush to adjust rates, even as they acknowledged policy-makers in the U.S. and Europe have indicated they may introduce cuts to respond to weakened global economic activity. In its statement the bank said, “Recent data show the Canadian economy is returning to potential growth. However, the outlook is clouded by persistent trade tensions. Taken together, the degree of accommodation being provided by the current policy interest rate remains appropriate.”
The United Kingdom became the first major economy to enact a net-zero carbon emissions policy. Energy and Clean Growth Minister Chris Skidmore signed the legislation into effect requiring the UK to bring all greenhouse gas emissions to net zero by 2050. The new regulations greatly exceed the previous target of cutting emissions at least 80% below 1990 levels. In his statement Skidmore said, “The U.K. kick-started the Industrial Revolution, which was responsible for economic growth across the globe but also for increasing emissions. Today we’re leading the world yet again in becoming the first major economy to pass new laws to reduce emissions to net zero by 2050.”
On Europe’s mainland, U.S. President Trump has threatened to extend its trade war to France in response to their recently enacted 3% digital tax on U.S. technology giants. The French Senate approved a 3% levy on tech giants including Facebook, Apple, Amazon, and Google. U.S. Trade Representative Robert Lighthizer said in a statement, “The United States is very concerned that the digital services tax, which is expected to pass the French Senate tomorrow, unfairly targets American companies. The President has directed that we investigate the effects of this legislation and determine whether it is discriminatory or unreasonable and burdens or restricts United States commerce.” France is the first country in Europe to introduce this kind of tax, which would apply to any digital company with revenue over 750 million euros of which 25 million is generated in France.
The International Monetary Fund (IMF) warned that the German economy will be “hit hard” by a global economic slowdown. In a new assessment of the country’s economic performance, the IMF warned, “The export-dependent economy has been hit hard by the slowdown in global demand. The country’s export dependence and financial openness make it particularly vulnerable to external shocks. Rising global protectionism, a more pronounced China slowdown or a no-deal Brexit would hurt exports and investment.” After several years of real GDP growth averaging over 2% annually, Germany’s economy slowed sharply in the second half of 2018. However, growth is expected to pick up by the end of this year, resulting in growth of 0.7% in 2019 and 1.7% in 2020.
A recent poll of analysts by Reuters revealed that China’s economic growth is expected to slow to 6.2% this year—a near 30-year low. The main culprit is the hundred to billions of dollars in tariffs levied by the Trump administration over the last year. In response to the tariffs, the Chinese government has resorted to a domestic stimulus package in order to cope with the impact of the trade war. Short-term interest rates have been brought down lower, and the People’s Bank of China has reduced the reserve requirement ratio for banks six times since last year. The analysts expect the People’s Bank of China will continue to ease policy for the rest of the year. China is expected to release its gross domestic product numbers for the second quarter this coming week.
Finally: To all except the most hard-core techies, “the cloud” is some mysterious place that stores all of your data, photos, music, and applications – all online and often for free. For businesses, “the cloud” has become the go-to place for new software development and application deployment (known in the business world as “IaaS” – Infrastructure as a Service). But where exactly is this “cloud”, and who owns it? The answer is, to a large degree, Amazon – much more than the company that will sell you anything and deliver it tomorrow. Amazon Web Services (AWS) is far and away the most dominant provider of cloud services, with a market share of over 41% – greater than the next four competitors combined. (Chart from RapidValueSolutions.com)

(Sources: all index return data from Yahoo Finance; Reuters, Barron’s, Wall St Journal, Bloomberg.com, ft.com, guggenheimpartners.com, zerohedge.com, ritholtz.com, markit.com, financialpost.com, Eurostat, Statistics Canada, Yahoo! Finance, stocksandnews.com, marketwatch.com, wantchinatimes.com, BBC, 361capital.com, pensionpartners.com, cnbc.com, FactSet) These are the opinions of WE Sherman and Co and not necessarily those of Cambridge, are for informational purposes only, and should not be construed or acted upon as individualized investment advice.
Securities offered through Registered Representatives of Cambridge Investment Research Inc., a broker-dealer, member FINRA/SIPC. Advisory Services offered through Cambridge Investment Research Advisors, a Registered Investment Adviser. Strategic Investment Partners and Cambridge are not affiliated.
Indices mentioned are unmanaged and cannot be invested into directly. Past performance is no guarantee of future results. All Investing involves risk. Depending on the types of investments, there may be varying degrees of risk. Investors should be prepared to bear loss, including total loss of principal.