
7-1-19 Weekly Market Update
The Very Big Picture:
The long-term valuation of the market is commonly measured by the Cyclically Adjusted Price to Earnings ratio, or “CAPE”, which smooths out shorter-term earnings swings in order to get a longer-term assessment of market valuation. A CAPE level of 30 is considered to be the upper end of the normal range, and the level at which further PE-ratio expansion comes to a halt (meaning that increases in market prices only occur in a general response to earnings increases, instead of rising “just because”). The market is currently at that level.
Of course, a “mania” could come along and drive prices higher – much higher, even – and for some years to come. Manias occur when valuation no longer seems to matter, and caution is thrown completely to the wind as buyers rush in to buy first and ask questions later. Two manias in the last century – the 1920’s “Roaring Twenties” and the 1990’s “Tech Bubble” – show that the sky is the limit when common sense is overcome by a blind desire to buy. But, of course, the piper must be paid and the following decade or two are spent in Secular Bear Markets, giving most or all of the mania gains back.
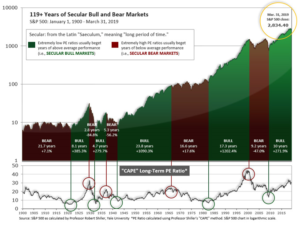
See Fig. 1 for the 100-year view of Secular Bulls and Bears. The CAPE is now at 29.99, down slightly from the prior week’s 30.09, above the level reached at the pre-crash high in October, 2007. Since 1881, the average annual return for all ten year periods that began with a CAPE around this level have been in the 0% – 3%/yr. range. (see Fig. 2).

In the Big Picture:
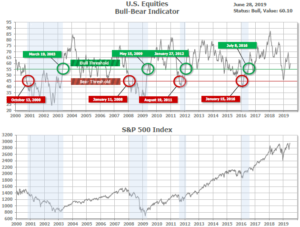
The “big picture” is the months-to-years timeframe – the timeframe in which Cyclical Bulls and Bears operate. The U.S. Bull-Bear Indicator (see Fig. 3) is in Cyclical Bull territory at 60.10, up from the prior week’s 58.73.
In the intermediate and Shorter-term Picture:
The Shorter-term (weeks to months) Indicator (see Fig. 4) turned positive on June 4th. The indicator ended the week at 19, unchanged from the prior week. Separately, the Intermediate-term Quarterly Trend Indicator – based on domestic and international stock trend status at the start of each quarter – was positive entering July, indicating positive prospects for equities in the third quarter of 2019.

Timeframe summary:
In the Secular (years to decades) timeframe (Figs. 1 & 2), the long-term valuation of the market is historically too high to sustain rip-roaring multi-year returns. The Bull-Bear Indicator (months to years) remains positive (Fig. 3), indicating a potential uptrend in the longer timeframe. In the intermediate timeframe, the Quarterly Trend Indicator (months to quarters) is positive for Q3, and the shorter (weeks to months) timeframe (Fig. 4) is positive. Therefore, with three indicators positive and none negative, the U.S. equity markets are rated as Positive.
In the markets:
U.S. Markets: The major U.S. indexes were mixed for the week. The large-cap benchmarks retreated from the record highs established the previous week, while the S&P 400 midcap index and small cap Russell 2000 index recorded modest gains. The Dow Jones Industrial Average declined 119 points to end the week at 26,600, a loss of -0.5%. The technology-heavy NASDAQ Composite gave up -0.3% but held the 8,000-level closing at 8,006. By market cap, the large cap S&P 500 fell by -0.3%, while the S&P 400 gained 0.9%, and the small cap Russell 2000 added 1.1%.
International Markets: Canada’s TSX retreated -0.9%, while the United Kingdom’s FTSE gained 0.2%. Major markets were mixed on Europe’s mainland with France’s CAC 40 and Germany’s DAX rising 0.2% and 0.5%, respectively, while Italy’s Milan FTSE finished down -0.7%. In Asia, China’s Shanghai Composite fell -0.8% and Japan’s Nikkei ticked up 0.1%. As grouped by Morgan Stanley Capital International, developed markets rose 0.6%, while emerging markets added 0.3%.
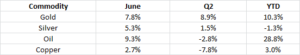
Commodities: In commodities, Gold rose as high as $1442 an ounce before settling back and closing at $1413.70, a gain of 1%. Silver also finished the week up, gaining 0.33%. Crude oil had its second week of gains, rising 1.8% to close at $58.47 per barrel. The industrial metal copper, viewed by analysts as a barometer of global economic health due to its wide variety of uses, ended the week essentially flat, up just 0.04%.
June and Q2 Summary, US Markets: It was a great June and a good Q2 for US markets. May’s declines were recovered in June, and then some.

June and Q2 Summary, International Markets: As in the U.S., a strong June salvaged the quarter for most international indexes, with only Italy and the two Chinese indexes logging a negative quarter. Double-digit year to date returns are the rule for all but Japan’s Nikkei.

June and Q2 Summary, Commodities: Major commodities were up in June, but had a mixed Q2. After a very strong Q1, oil slumped in Q2, but still leads the way among commodities, up 28.8% for the year to date. Copper was down the most in Q2 as continued economic growth came into question. Gold and silver usually move in parallel directions, but have gone their own ways so far this year, with gold nicely up and silver down for the year to date.
U.S. Economic News: The number of Americans applying for first-time unemployment benefits rose to a 7-week high of 227,000 last week. Economists had estimated new claims would total a seasonally adjusted 216,000. Analysts generally look at the less-volatile monthly average of new claims, which increased only 2,250 to a still remarkably low 221,250. Analysts consider readings below 300,000 a “healthy” jobs market. The number of Americans already collecting benefits, so-called continuing claims, rose slightly to 1.69 million and remains near multi-decade lows. The nation’s strong labor market continues to support the U.S. economy in the face of rising headwinds such as the trade dispute with China, weaker global economy, and slowing growth among manufacturers and homebuilders.
Sales of new single-family homes fell to a 5-month low in May, falling for the second month in a row. The Commerce Department reported new-home sales ran at a 626,000 seasonally adjusted annual rate in June. Economists had expected a 669,000 pace. Sales were down 7.8% compared to April and down 3.7% from the same time last year. At the current pace of sales, it would take 6.4 months to exhaust the available supply. Analysts generally consider 6 months a “balanced” housing market. The median price of a new home sold in May was $308,000—2.7% lower than a year ago. Note that the Commerce Department’s data on new residential construction are based on small sample sizes and are often significantly revised. Year to date, sales are 4.0% higher than the same period a year ago.
The National Association of Realtors (NAR) reported the number of homes under contract, but not yet closed, rose by a seasonally-adjusted 1.1% in May, but was 0.7% lower than the same time last year. The increase in May beat the consensus forecast for a 0.6% rise. May’s reading marked the 17th consecutive month of declines on an annual basis. By region, NAR reported pending sales in the Northeast were 3.5% higher, 3.6% higher in the Midwest, down ‑1.8% in the West and up 0.1% in the South.
Home prices were flat in April according to the S&P Case-Shiller 20-city home price index. April was the 13th straight month in which annual growth slowed, and the lowest pace of annual gains since August of 2012. The cities with the strongest gains continue to be those in warm climates, but their rates of price growth are nowhere near the double-digit gains seen in Seattle and San Francisco not long ago. In the details, the slowest monthly pace of change was in New York, which was flat, while the slowest annual growth was in Seattle—also unchanged. Economists at Oxford Economics wrote in a note to clients, “Signs of a global house price downturn are already visible, with around a third of our sample of economies seeing falling prices and world residential investment starting to decline. High house price valuations add to the risk that this downturn will deepen in the coming quarters, hitting consumer spending.”
Confidence among the nation’s consumers fell to an almost 2-year low as trade tensions with China continue to escalate. The Conference Board reported its consumer confidence index plunged this month to 121.5 from a revised 131.1 in May. The reading was its weakest since September of 2017 and far below economists’ expectations for a reading of 130.4. The decline adds to mounting evidence showing slowing U.S. economic growth and more pessimism about the future. In the details, the measure of how Americans see the current economy slid 8 points to a one-year low of 162.6. In addition, more Americans said jobs were harder to get than in the prior month—16.4% versus 11.8%. However, the survey was conducted in mid-June when President Trump had threatened to apply tariffs to all Mexican imports and before the surge in U.S. equity markets that has pushed equities back to near-record highs. The University of Michigan reported its survey of consumer sentiment also declined this month with households with incomes in the top third responsible for the majority of the decline. The University of Michigan said the final reading of its consumer sentiment index in June was 98.2, down from the 100 reading in May. Economists expected a reading of 98.
A measure of business activity in the Windy City fell into contraction in June for the first time in two years. The Chicago Purchasing Managers’ Index (PMI) declined to 49.7 this month, down from 54.2 in May. The index was as high as 64.7 just four months ago. The survey found that a whopping 80% of firms said the trade tariffs had negatively impacted their businesses, with rising prices leading to a pullback in orders. Shaily Mittal, senior economist at MNI Indicators stated, “With customers rethinking their purchases, demand tumbled, and consequently firms pulled back production, weakening overall sentiment.” PMI values less than 50 are in contraction territory.
Orders for goods expected to last at least 3 years, so-called “durable goods”, dropped 1.3% last month, its third decline in the last four months. Economists had expected only a 1% decline. The main catalyst appears to have been a sharp decline in orders for Boeing’s 737 Max jet. Boeing has received barely any orders since Max flights were suspended following a pair of deadly crashes earlier this year. On a positive note, orders for autos rose 0.6% in May, along with orders for heavy machinery, primary metals, computers, and networking gear. In addition, a key measure of business investment, core orders, advanced 0.4% last month—its biggest increase since the beginning of the year. Economist Andrew Hollenhurst of Citi Research wrote in a note, “The stronger-than-expected increase in core capital goods orders is a positive sign that underlying investment has not softened further despite overall weakness in industrial sector activity.”
International Economic News: After a dismal performance last winter, Canada’s economy seems to have sprung back to life. Statistics Canada reported Canada’s gross domestic product, which tracks broad activity in goods and services, climbed 0.3% in April from the previous month. That reading follows a 0.5% advance in March. Market expectations were for just a 0.1% gain according to economists at Royal Bank of Canada. The increase in output in April was predominantly due to energy production, mining, and wholesale trade. On a year-over-year basis, the Canadian economy grew 1.5% through April. “The consensus-topping GDP results for April confirm the Canadian economy is bouncing back nicely in the second quarter,” said Krishen Rangasamy, economist at National Bank Financial in Montreal.
The United Kingdom became the world’s first major economy to legislate the end of its contribution to global warming by passing a law to cut greenhouse gas emissions to “net zero” by 2050. The target was announced earlier this month by outgoing Prime Minister Theresa May, who called it “crucial” for protecting the planet. The 2050 goal, which replaces a previous target to slash emissions 80% below 1990 levels by the same deadline, has been added as an amendment to the UK’s 2008 Climate Change Act. It will require Britain to add vast amounts of renewable energy, phase out fossil fuel vehicles by 2035, and cut beef and lamb consumption by 20%.
The worst of the impact on the French economy from the “yellow-vest” protests, which rocked major cities in France last winter, is yet to come said a report from the French Senate. The report predicts a wave of bankruptcies among small businesses in the second half of the year as the accumulated loss of business activity in city centers will take its toll in the coming months. The national statistics office estimated the loss at 0.1% of national output or 2 billion euros ($2.28 billion) in the final quarter of last year. The knock-on effect of delayed payments to suppliers, as well as temporarily suspended tax bills that will eventually come due, are expected to push many small shopkeepers into bankruptcy.
The Munich-based Ifo Institute for Economic Research warned the German economy is “heading for the doldrums” as its business climate index deteriorated for the third month in a row. The business index fell to 97.4 in June, down from the 97.9 recorded in May. The reading marked its lowest level since November 2014. Germany has been hit particularly hard by rising global trade tensions as it is a major exporter of vehicles. Berlin has seen its manufacturing sector plunge into recession territory, where it still remained in June. Ifo President Clemens Fuest warned the business climate in both the manufacturing and services sectors had worsened. The Bundesbank said this month it expects the economy to contract slightly in the second quarter after an expansion of 0.4% between January and March.
President Trump relaxed limits on Chinese telecommunications giant Huawei and delayed new tariffs on Chinese goods following his meeting with Chinese President Xi Jinping at the G-20 summit in Japan. The decision was welcomed by business groups that have been hurt by the escalating tariffs on Chinese goods and feared greater damage should more tariffs be enacted. In exchange for the concession, Trump said China had agreed to purchase large amounts of farm products from U.S. companies. But he offered no specifics and Chinese officials did not confirm that they had made this offer. A statement from China’s Foreign Ministry quoted Xi as telling Trump that China was willing to continue talks with the Trump administration, but that “negotiations should be equal and show mutual respect.”
The Bank of Japan’s Deputy Governor Masazumi Wakatabe stated the BOJ stands ready to ease monetary policy pre-emptively to fend off risks that could derail the economy’s path toward achieving its 2% inflation target. Wakatabe stated with U.S.-China trade tensions weighing on business sentiment and slowing Chinese demand hurting its exports, there is a “significant risk” the BOJ may be forced to alter its current assessment that Japan’s economy will continue to expand at a moderate pace. “If the economy comes under severe downward pressure and we can say with confidence the momentum for achieving our price target is being lost, the BOJ must ease policy immediately without hesitation,” he told a news conference. The BOJ kept policy steady last week but Governor Haruhiko Kuroda signaled readiness to ramp up stimulus as global risks cloud the economic outlook.
Finally: Remember Bitcoin? It was in the headlines frequently as it ripped from $200 to nearly $20,000, peaking in December of 2017. It then collapsed back to the $3,000 range over the next year. Bitcoin is making headlines again as the cryptocurrency hit a high near $14,000 this week before quickly falling back to the $12,000 level. Three researchers at Harvard have determined that parabolic rises in asset prices of the magnitude shown by Bitcoin in both its earlier and more recent leaps higher give way to crashes 80% of the time over a long and storied history of bubbles and collapses (“Bubbles for Fama”, Journal of Financial Economics). Of course, each bubble had plenty of proponents insisting that “it’s different this time”, and Bitcoin is no different. Mark Hulbert of Marketwatch.com created the graphic below to illustrate the researchers’ findings.

(Sources: all index return data from Yahoo Finance; Reuters, Barron’s, Wall St Journal, Bloomberg.com, ft.com, guggenheimpartners.com, zerohedge.com, ritholtz.com, markit.com, financialpost.com, Eurostat, Statistics Canada, Yahoo! Finance, stocksandnews.com, marketwatch.com, wantchinatimes.com, BBC, 361capital.com, pensionpartners.com, cnbc.com, FactSet) These are the opinions of WE Sherman and Co and not necessarily those of Cambridge, are for informational purposes only, and should not be construed or acted upon as individualized investment advice.
Securities offered through Registered Representatives of Cambridge Investment Research Inc., a broker-dealer, member FINRA/SIPC. Advisory Services offered through Cambridge Investment Research Advisors, a Registered Investment Adviser. Strategic Investment Partners and Cambridge are not affiliated.
Indices mentioned are unmanaged and cannot be invested into directly. Past performance is no guarantee of future results. All Investing involves risk. Depending on the types of investments, there may be varying degrees of risk. Investors should be prepared to bear loss, including total loss of principal.