
7-6-20 Weekly Market Update
The very Big Picture
The long-term valuation of the market is commonly measured by the Cyclically Adjusted Price to Earnings ratio, or “CAPE”, which smooths-out shorter-term earnings swings in order to get a longer-term assessment of market valuation. A CAPE level of 30 is considered to be the upper end of the normal range, and the level at which further PE-ratio expansion comes to a halt (meaning that further increases in market prices only occur as a general response to earnings increases, instead of rising “just because”). The market was recently at that level.
Of course, a “mania” could come along and drive prices higher – much higher, even – and for some years to come. Manias occur when valuation no longer seems to matter, and caution is thrown completely to the wind – as buyers rush in to buy first, and ask questions later. Two manias in the last century – the “Roaring Twenties” of the 1920s, and the “Tech Bubble” of the late 1990s – show that the sky is the limit when common sense is overcome by a blind desire to buy. But, of course, the piper must be paid, and the following decade or two were spent in Secular Bear Markets, giving most or all of the mania-gains back.
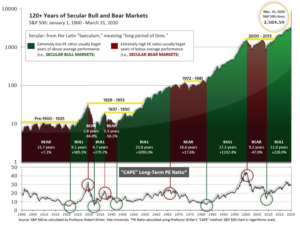
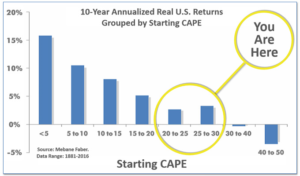
See Fig. 1 for the 100-year view of Secular Bulls and Bears. The CAPE is now at 29.35, up from the prior week’s 28.22. Since 1881, the average annual return for all ten-year periods that began with a CAPE in the 20-30 range have been slightly-positive to slightly-negative (see Fig. 2).
Note: We do not use CAPE as an official input into our methods. However, if history is any guide – and history is typically ‘some’ kind of guide – it’s always good to simply know where we are on the historic continuum, where that may lead, and what sort of expectations one may wish to hold in order to craft an investment strategy that works in any market ‘season’ … whether current one, or one that may be ‘coming soon’!
The Big Picture:
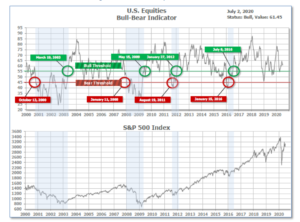
The ‘big picture’ is the (typically) years-long timeframe – the timeframe in which Cyclical Bulls and Bears operate. The U.S. Bull-Bear Indicator is in Cyclical Bull territory at 61.45 down from the prior week’s 60.91.
In the Quarterly- and Shorter-term Pictures
The Quarterly-Trend Indicator based on the combination of U.S. and International Equities trend-statuses at the start of each quarter – was Negative entering April, indicating negative prospects for equities in the second quarter of 2020. (On the ‘daily’ version of the Quarterly-Trend Indicator, where the intra-quarter status of the Indicator is subject to occasional change, both the U.S. Equities and International Equities readings remain in ‘Down’ status; the daily International reading turned to Down on Thursday, Feb. 27th; the U.S. daily reading turned to Down on Friday, Feb. 28th.)
Next, the short-term(weeks to months) Indicator for US Equities turned positive on June 16 and ended the week at 22, up from the prior week’s 19.
The Complete Picture:
Counting-up of the number of all our indicators that are ‘Up’ for U.S. Equities (see Fig. 3), the current tally is that three of four are Positive, representing a multitude of timeframes (two that can be solely days/weeks, or months+ at a time; another, a quarter at a time; and lastly, the {typically} years-long reading, that being the Cyclical Bull or Bear status).
In the Markets:
U.S. Markets: U.S. stocks recorded solid gains for the holiday-shortened week, helping to lift the technology-heavy NASDAQ Composite Index to a record intraday high. The large cap S&P 500 hit its highest level since mid-June. The week closed out the best quarter for the Dow Jones Industrial Average and the S&P 500 since 1987 and 1988, respectively. The Dow Jones Industrial Average added 812 points to finish the week at 25,827, a gain of 3.2%. The NASDAQ added 450 points and finished at 10,208, a 4.6% increase. By market cap, large caps led the way with the S&P 500 adding 4.0%, while the mid cap S&P 400 and small cap Russell 2000 rose 3.5% and 3.8%, respectively.
International Markets: Canada’s TSX retraced last week’s entire decline and then some by advancing 2.7%. The United Kingdom’s FTSE finished essentially flat, down just 2 points. On Europe’s mainland, France’s CAC 40 and Germany’s DAX rose 2.0% and 3.6%, respectively. In Asia, China’s Shanghai Composite surged 5.8%, while Japan’s Nikkei finished down ‑0.9%. As grouped by Morgan Stanley Capital International, developed markets added 2.1% while emerging markets gained 3.6%.
Commodities: Gold rose for a fourth consecutive week, closing at $1790 an ounce and notching a gain of 0.5%. Silver added 1.6% to finish the week at $18.32 ounce. Oil retraced the prior week’s entire decline, rising 5.6% and finishing the week at $40.65 per barrel of West Texas Intermediate crude. Copper, viewed by some analysts as a barometer of global economic health due to its wide variety of industrial uses, rose for a seventh consecutive week, up 2.6%.
June and Q2 Summary: For the month of June, the NASDAQ Composite was the clear winner, gaining 6.0%, followed by the small cap Russell 2000, up 3.4%. Large caps, mid caps, and the Dow rose 1.8%, 1.1%, and 1.7%, respectively. For the second quarter there were double-digit gains across the board. The NASDAQ surged a huge 30.6%, followed by the small cap Russell 2000, up 25.0%. The S&P 400 and S&P 500 gained 23.5% and 20.0%, respectively, and the Dow Jones Industrials added 17.8%.
All of the major ex-US global markets finished the month of June to the upside. Canada’s TSX rose 2.1% and the UK’s FTSE added 1.5%. France’s CAC 40 rose 5.1% and the DAX gained 6.2%. China’s Shanghai Composite jumped 4.6%, while Japan’s Nikkei ended the month up 1.9%. Emerging markets recovered 6.6%, while developed markets gained 3.5%. For the quarter, the DAX led the way adding 23.9% followed by the Nikkei, up 17.8%, and the TSX up 16%. France, the UK, and China rounded out the bottom three with 12.3%, 8.8%, and 8.5% gains respectively. Developed markets rose 15.5%, while emerging markets gained 17.9%.
For the month of June Gold and Silver rose 2.8% and 0.8%, respectively. Oil added 10.7%, while copper surged 12.3%. In the second quarter of the year, Gold rose 9.7%, Silver rallied 30.7%, and oil skyrocketed 73.3%. Copper finished the second quarter up 9.1%.
U.S. Economic News: The number of Americans filing first-time unemployment benefits continued to slow last week, but remained above the consensus expectation. Initial claims for unemployment insurance fell by 55,000 to 1.427 million. Economists had expected a reading of 1.380 million. It was the 13th consecutive decline, as labor market conditions continued to improve with the reopening of the economy. Continuing claims for unemployment benefits, which counts the number of Americans already receiving benefits, rose by 59,000 to 19.290 million. The unemployment rate fell to 11.1% in June from 13.3% in the prior month. More than 50 million new claims have been filed since mid-March. Before the pandemic, claims averaged around 225,000 per week.
Another 4.8 million Americans went back to work in June sending the unemployment rate down to 11.1%, the Bureau of Labor Statistics reported. The increase in new jobs exceeded economists’ forecasts of 3.7 million. Millions of people have returned to work since the states began to reopen in May. However, the survey used to compile the report took place before the latest wave of new coronavirus cases erupted. The U.S. lost more than 22 million jobs during the height of the pandemic and has restored about 7.5 million of them in the past two months. Analysts were quick to caution against expecting these strong numbers to continue. Sal Guatieri, senior economist at BMO Capital Markets wrote in a note to clients, “The end of the lockdowns has allowed for a faster than expected recovery in jobs in the past two months, but more recent events and data suggest much tougher slogging ahead.”
After two consecutive months of declines, an early measure of housing demand staged a historic rebound. The National Association of Realtors (NAR) reported its index of pending home sales soared 44.3% in May—its largest monthly percentage increase on record. The result led many analysts to conclude that the worst may have already come for the real-estate market. Lawrence Yun, chief economist for the NAR, stated “This has been a spectacular recovery for contract signings, and goes to show the resiliency of American consumers and their evergreen desire for homeownership.” The index measures real-estate transactions for previously-owned homes where a contract was signed but the sale had not yet closed. Analysts use the pending home sales data to get an “early read” on actual sales in the near future.
Home-prices have maintained a steady upward trajectory according to data from S&P CoreLogic. The S&P CoreLogic Case-Shiller 20-city price index posted a 4% annual gain in April, up 0.1% from the previous month. On a monthly basis, the index increased 0.9% between March and April. Phoenix continued to lead the country with an 8.8% annual price gain in April. Seattle was next, with a 7.3% gain, followed by Minneapolis, where home prices rose 6.4% over the past year. Prices were weaker in the Northeast. Overall, the pace of price growth increased in 12 of the 19 cities Case-Shiller analyzed (Detroit wasn’t included because transaction records were unavailable, the report noted).
Confidence among the nation’s consumers jumped to a 3-month high, but remains well below pre-pandemic levels. The Conference Board reported its index of consumer confidence rose to 98.1 in June. Economists had expected a reading of 90.8. However there’s one potentially big caveat. The cutoff date for the survey was June 18th, shortly before states such as Texas and Arizona re-imposed new restrictions after a new outbreak of COVID-19 cases. The level of confidence remains well below pre-crisis levels after steep declines in March and April. The index had stood near a 20-year high at 132.6 in February before the pandemic shut down swaths of the economy. It fell to a low of 85.7 in April.
Manufacturing activity rebounded strongly in June according to the Institute for Supply Management (ISM). ISM reported its Manufacturing Index surged 9.5 points in June to 52.6. Economists had expected a reading of 49.5. It was the biggest jump since August 1980 and to the highest level in over a year as factory activity returned to growth mode after the COVID shutdown. In the details, thirteen of the eighteen ISM industries grew indicating a broadening expansion. Most ISM components increased led by near-record jumps in new orders and production. Supplier deliveries slowed at a slower pace, which was a positive development as it reflected diminishing supply chain issues.
International Economic News: Statistics Canada reported that the Canadian economy had its biggest contraction on record, shrinking by almost 12% in April. Economists had expected a drop of 13% for April. The agency said gross domestic product (GD) fell 11.6% in April with all non-essential businesses shut for the full month. The reading followed a 7.5% decline in March. In the report, manufacturing was down 22.5% in April as many factories either shuttered or greatly reduced capacity. Even sectors like food manufacturing that had been spared in March succumbed as outbreaks at meat processing plants forced shutdowns. On a positive note, Statistics Canada also reported its initial flash estimate for May points to a return to growth of 3%.
Across the Atlantic, although the economic outlook for the United Kingdom remains gloomy, strategists at Swiss bank UBS believe the country’s assets are “heavily undervalued”. The U.K.’s GDP saw its sharpest contraction since 1979 in the first quarter, and the balance-of-trade deficit widened to £21.1 billion ($26.4 billion). However, the UBS strategists suggested that a promised £5 billion of government infrastructure spending and several key market dynamics place the U.K. in “pole position” to outperform. “We see the UK as benefiting in an upside scenario for the global economic recovery, among other markets, including U.S. mid-caps, German industrials, and consumer brands,” said Mark Haefele, the chief investment officer of UBS Global Wealth Management.
In a major shakeup, French President Emmanuel Macron named a new Prime Minister following the resignation of Edouard Phillipe. Jean Castex was appointed to the job this week, after former Prime Minister Philippe handed in his resignation earlier in the day. Castex, a center-right politician like Philippe, had already been involved with the government after he was enlisted in April to help with its re-opening plans. In France, the President — the main political figure — selects the Prime Minister, who then forms the government.
German Chancellor Angela Merkel and President of the European Commission Ursula von der Leyen insisted that European Union members reach a speedy agreement on the coronavirus recovery fund for the European Union. The two politicians held a joint virtual press conference where they outlined the goals for Germany’s six-month presidency of the EU, which Germany officially took over on July 1. “We have an unprecedented crisis and it needs an unprecedented response,” von der Leyen stated. The EU is currently in talks over an economic stimulus and investment program worth 750 billion euros to be controversially financed through shared debts. The heads of state and government of the member states will debate the plan on July 17 and July 18.
China’s services sector expanded at its fastest pace in over a decade in June as the easing of coronavirus lockdown measures revived consumer demand. Markit reported its Purchasing Managers’ Index (PMI) for the services sector rose to 58.4 in June—its highest reading since April 2010. The services sector accounts for about 60% of China’s economy. New export business also expanded for the first time since January on firmer foreign demand. Markit stated its purchasing managers’ index for manufacturing also rose, albeit less spectacularly, to 51.2 compared to 50.7 in May.
Factory output in Japan fell for a fourth consecutive month as its economy sank deeper into recession. Japan’s Ministry of Economy, Trade and Industry (METI) data showed that factory output fell 8.4% month-on-month in May to 79.1, a level not seen since March 2009 when the financial crisis sapped global demand. However on a brighter note, credit research company Teikoku Databank reported business sentiment improved for the first time in nine months. The upturn reflected the economic activity sparked by the government’s lifting of the state of emergency in late May.
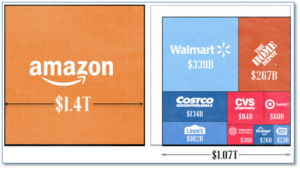
Finally: As America celebrates its Independence Day, more and more Americans are dependent on Amazon. The e‑commerce behemoth’s stock sits at all-time highs, and its president Jeff Bezos is (by far) the richest man in the world. Everyone knows that Amazon is big in the retail space, but just how big may surprise many. VisualCapitalist created an infographic showing Amazon’s valuation compared to the country’s nine next-largest retailers. In short, the market valuation of all of the next nine companies, from Costco to Walmart, added together still lag Amazon’s by almost half a trillion dollars.
(Sources: All index- and returns-data from Yahoo Finance; news from Reuters, Barron’s, Wall St. Journal, Bloomberg.com, ft.com, guggenheimpartners.com, zerohedge.com, ritholtz.com, markit.com, financialpost.com, Eurostat, Statistics Canada, Yahoo! Finance, stocksandnews.com, marketwatch.com, wantchinatimes.com, BBC, 361capital.com, pensionpartners.com, cnbc.com, FactSet.) Securities offered through Registered Representatives of Cambridge Investment Research Inc., a broker-dealer, member FINRA/SIPC. Advisory Services offered through Cambridge Investment Research Advisors, a Registered Investment Adviser. Strategic Investment Partners and Cambridge are not affiliated. Indices mentioned are unmanaged and cannot be invested into directly. Past performance is no guarantee of future results.