
6-29-20 Weekly Market Update
The very Big Picture
The long-term valuation of the market is commonly measured by the Cyclically Adjusted Price to Earnings ratio, or “CAPE”, which smooths-out shorter-term earnings swings in order to get a longer-term assessment of market valuation. A CAPE level of 30 is considered to be the upper end of the normal range, and the level at which further PE-ratio expansion comes to a halt (meaning that further increases in market prices only occur as a general response to earnings increases, instead of rising “just because”). The market was recently at that level.
Of course, a “mania” could come along and drive prices higher – much higher, even – and for some years to come. Manias occur when valuation no longer seems to matter, and caution is thrown completely to the wind – as buyers rush in to buy first, and ask questions later. Two manias in the last century – the “Roaring Twenties” of the 1920s, and the “Tech Bubble” of the late 1990s – show that the sky is the limit when common sense is overcome by a blind desire to buy. But, of course, the piper must be paid, and the following decade or two were spent in Secular Bear Markets, giving most or all of the mania-gains back.
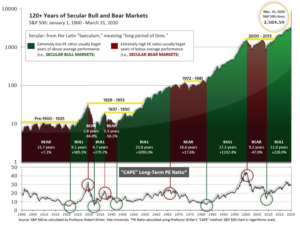
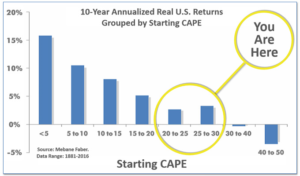
For the 100-year view of Secular Bulls and Bears. The CAPE is now at 28.22, down from the prior week’s 29.05. Since 1881, the average annual return for all ten-year periods that began with a CAPE in the 20-30 range have been slightly-positive to slightly-negative.
Note: We do not use CAPE as an official input into our methods. However, if history is any guide – and history is typically ‘some’ kind of guide – it’s always good to simply know where we are on the historic continuum, where that may lead, and what sort of expectations one may wish to hold in order to craft an investment strategy that works in any market ‘season’ … whether current one, or one that may be ‘coming soon’!
The Big Picture:
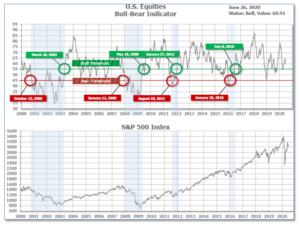
The ‘big picture’ is the (typically) years-long timeframe – the timeframe in which Cyclical Bulls and Bears operate. The U.S. Bull-Bear Indicator is in Cyclical Bull territory at 60.91 down from the prior week’s 62.97.
In the Quarterly- and Shorter-term Pictures
The Quarterly-Trend Indicator based on the combination of U.S. and International Equities trend-statuses at the start of each quarter – was Negative entering April, indicating negative prospects for equities in the second quarter of 2020. (On the ‘daily’ version of the Quarterly-Trend Indicator, where the intra-quarter status of the Indicator is subject to occasional change, both the U.S. Equities and International Equities readings remain in ‘Down’ status; the daily International reading turned to Down on Thursday, Feb. 27th; the U.S. daily reading turned to Down on Friday, Feb. 28th.)
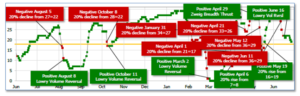
Next, the short-term(weeks to months) Indicator for US Equities turned positive on June 16 and ended the week at 19, down from the prior week’s 22.
The Complete Picture
Counting-up of the number of all our indicators that are ‘Up’ for U.S. Equities (see Fig. 3), the current tally is that three of four are Positive, representing a multitude of timeframes (two that can be solely days/weeks, or months+ at a time; another, a quarter at a time; and lastly, the {typically} years-long reading, that being the Cyclical Bull or Bear status).
In the Markets:
U.S. Markets: Worries over the resurgence of the coronavirus offset the enthusiasm over some positive U.S. economic reports; most U.S. markets gave back all of the previous week’s gains—and then some. The Dow Jones Industrial Average fell 859 points finishing the week at 25,016—a decline of -3.3%. The technology-heavy Nasdaq Composite gave up half of last week’s gain declining -1.9%. By market cap, the large cap S&P 500 retreated -2.9%, while the mid cap S&P 400 fell -3.7%, and the small cap Russell 2000 ended down -2.8%.
International Markets: Major international markets finished mostly to the downside. Canada’s TSX fell -1.8%, while the UK’s FTSE 100 declined -2.1%. On Europe’s mainland, France’s CAC 40 retreated -1.4%, Germany’s DAX gave up ‑2.0%, and Italy’s Milan FTSE ended down -2.5%. In Asia, China’s Shanghai Composite managed a 0.4% gain, while Japan’s Nikkei ticked up 0.1%. As grouped by Morgan Stanley Capital International, developed markets finished the week down -0.9%, while emerging markets rose a scant 0.1%.
Commodities: Precious metals finished the week up, thanks to the weakness in the equities markets. Gold rose 1.6% last week to $1780.30 per ounce, while Silver added 1.1% to $18.03. Oil had its second down week in nine finishing down -3.4% to $38.49 per barrel of West Texas Intermediate crude. The industrial metal copper, viewed by some analysts as a barometer of global economic health due to its wide variety of uses, rose for a sixth consecutive week finishing up 2.6%.
U.S. Economic News: The number of Americans claiming first-time unemployment benefits fell last week, the 12th decline in a row. The Labor Department reported initial claims for unemployment insurance declined by 60,000 to 1.480 million. Economists had expected a reading of just 1.35 million. Despite the improvement, claims remain far above the levels seen at the beginning of the year (between 200,000-300,000). Continuing claims, which counts the number of people already receiving benefits, declined for a third consecutive week. Continuing claims fell by 767,000 to 19.522 million, indicating the peak was likely seen in early May. More than 50 million applications for benefits have been filed in the past three months.
New home sales surged last month as pent-up demand to purchase a home was unleashed. New home sales jumped 16.6% in May, the government reported, the most in nearly a year and the second-largest gain since 1992 to a 676,000 unit annual rate. The reading exceeded the consensus forecast for an increase of 640,000. Three of the four regions posted double-digit gains in May, however sales fell in the Midwest by 6.4%. The median sales price for new homes sold in May was $317,900. At the end of the month, there were 318,000 new homes estimated to be up for sale, which equates to a 5.6-month supply. A 6-month supply of homes is generally considered to be indicative of a balanced market.
Sales of previously-owned homes continued to slide in May as the coronavirus continued to weigh on the U.S. real-estate market. The National Association of Realtors (NAR) reported existing-home sales occurred at a seasonally-adjusted annualized pace of 3.91 million. The reading was a 9.7% decline from April, and its lowest level since in 10 years. Compared with the same time last year, sales were down almost 27%. Lawrence Yun, chief economist for the NAR put his best construction on the report’s release writing, “Home sales will surely rise in the upcoming months with the economy reopening, and could even surpass one-year-ago figures in the second half of the year.” All regions reported a decrease, but sales fell most notably in the Northeast where they were down 13%.
Orders for goods expected to last at least three years, so-called “durable goods”, rebounded at their fastest pace in 6 years in May. The Department of Commerce reported durable goods orders rose 15.8% last month. Economists had expected an increase of 9.8%. The rebound in manufacturing and other key parts of the economy suggests the U.S. may have already exited what could turn out to be the shortest and deepest recession in American history. In the details, orders for automakers climbed 28% last month, although they still remain well below pre-crisis levels. Of note, aircraft manufacturers (and Boeing in particular) got good news of sorts. The giant manufacturer reported essentially no new orders in May, but cancellations declined. That accounted for almost half of the increase in durable-goods orders last month. Stripping out cars and planes (ex-transportation), orders grew by 4%–the most in almost ten years.
Consumer spending surged last month as the economy reopened, according to the latest report from the government. The Commerce Department reported its Personal Consumption Expenditures (PCE) index rebounded a record 8.2% in May. Analysts had expected an even larger 8.7% gain. The index had nosedived in April by a revised -12.6% amid widespread shutdowns triggered by the COVID-19 outbreak. However, despite the positive report Tim Quinlan and Shannon Seery, economists at Wells Fargo, reminded investors, “Before we celebrate the return of the consumer prematurely, [keep in mind that] personal consumption expenditures are still down 11.7 percent from their February peak.”
A pair of economic reports from research firm Markit showed the economic downturn in the U.S. appears to be nearing its end. IHS Markit reported both its ‘services’ and ‘manufacturing’ flash Purchasing Managers’ Indexes (PMI) hit 4-month highs this month. The flash U.S. service sector PMI rose 9.2 points to 46.7 in June, while the manufacturing sector PMI advanced 9.8 points to 49.6. Though both readings improved significantly, they remained below the crucial 50-level which indicates worsening conditions. The flash estimate is typically based on approximately 85%-90% of total survey responses each month. The composite index rose to 46.8 in June from 37 in the prior month, still in the sub-50 contraction territory.
The Chicago Fed reported its National Activity Index (CFNAI) rebounded in May by both a record increase and to a record high level as the economy began reopening after the pandemic-related shutdown. The CFNAI surged 20.5 points to 2.61 last month. The index’s three-month moving average, used to smooth the monthly volatility, improved to a -6.65 reading from -7.5 in April. The index is a weighted average of 85 economic indicators with 72 of its indicators improving in May while 13 deteriorated. A zero value for the index indicates the national economy is expanding at its historical trend rate of growth.
International Economic News: Ratings-agency Fitch downgraded Canada’s sovereign debt from AAA to AA+, citing a “deterioration of Canada’s public finances in 2020”. The country will run a “much expanded” general government deficit this year and emerge from recession with much higher public debt ratios, Fitch said. While the agency acknowledged the higher deficit was being largely driven by public spending to counteract the sharp fall in output, the economy’s investment and growth prospects are expected to continue to “face challenges” even once this spending is wound down. On a positive note, the country’s debt “ceiling” was maintained at AAA and its short-term debt was also affirmed, according to Kelli Bissett-Tom, director and primary ratings analyst at Fitch.
Despite shrinking at its fastest pace in centuries, the United Kingdom’s economy is likely to bounce back to growth next quarter according to a Reuter’s poll. As activity ground to a near-halt after the March 23 lockdown, the poll predicted the economy would contract -17.3% this quarter. But like other countries around the world, Prime Minister Boris Johnson has slowly started to ease lockdown restrictions and the economy was expected to bounce back as a result and grow 10.5% next quarter. “April was undoubtedly the low point in activity. We’ll probably see a more pronounced rebound during the third quarter as a broader range of businesses are expected to reopen,” said James Smith at ING.
On Europe’s mainland, the second biggest economy in the European Union – France – returned to growth this month even as activity in the rest of the region continued to decline. The initial reading of the country’s Purchasing Managers’ Index (PMI) for the manufacturing and services sectors, jumped 19.2 points to 51.3 in June. Note that readings above 50 indicate expansion rather than contraction. Chris Williamson, chief business economist at IHS Markit stated that “France looks to be leading the pack” on returning to growth. Williamson noted that countries seeing a revival in growth are being fueled by predominantly domestic demand. “If you have an export oriented manufacturing sector, which is the case in Germany, it acts as a dampener, compared to France,” he added.
Economic advisors to the German government drastically revised down their former growth forecasts for the current year, now expecting the country’s output to shrink by -6.5%. The panel had previously predicted a much smaller ‑2.8% drop in GDP for 2020. Industrial production has already decreased to its lowest level in two decades and export figures for May were devastating. According to the Kiel Institute for the World Economy (IfW), pandemic-related losses for the German economy will add up to some €390 billion ($440 billion) for this year and next.
The China Macroeconomy Forum (CMF) released a report stating it expects China’s economy to grow by 2.5%, 6.5%, and 7.5% year on year in the second, third, and fourth quarters of 2020, respectively. Upon completing the initial stage of economic recovery by resuming production and restoring the supply side of the economy, China is entering the next stage of demand expansion the report said. As one of the first economies to contain the epidemic and restart the economy, China’s recovery and re-consolidation of economic foundations has significance for the world economy, it said. Liu Xiaoguang, a researcher with Renmin University of China, suggested that rather than short-term quantitative goals, China’s economic policies should focus on mid- and long-term structural changes to facilitate future economic prospects.
The Bank of Japan is expected to lower its economic projections again next month as the impact of the coronavirus on the domestic and global economies becomes more clear. The International Monetary Fund said this week it sees the world economy shrinking -4.9% this year—sharply lower than its April view. However, analysts note that a downgrade by the Bank of Japan itself won’t necessarily translate to further easing action by the bank. Hiroshi Miyazaki, a senior economist at Mitsubishi UFJ Morgan Stanley Securities stated, “That won’t mean more easing, though. Their focus now is on funding of companies and financial markets.”
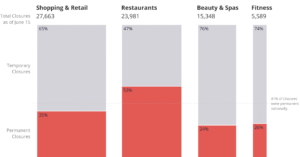
Finally: Can this be true? If so, the US economy may be in deeper trouble than most think. Review website ‘Yelp’ reported that of all business closures since March 1, 41% are permanent closures. The Restaurants category is the hardest hit, where Yelp said a whopping 53% are reported to be permanent closures. That was followed by Shopping & Retail at 35% permanent closures, Fitness at 26% permanent closures, and Beauty & Spas at 24% permanent closures. (chart from yelpeconomicaverage.com)
(Sources: All index- and returns-data from Yahoo Finance; news from Reuters, Barron’s, Wall St. Journal, Bloomberg.com, ft.com, guggenheimpartners.com, zerohedge.com, ritholtz.com, markit.com, financialpost.com, Eurostat, Statistics Canada, Yahoo! Finance, stocksandnews.com, marketwatch.com, wantchinatimes.com, BBC, 361capital.com, pensionpartners.com, cnbc.com, FactSet.) Securities offered through Registered Representatives of Cambridge Investment Research Inc., a broker-dealer, member FINRA/SIPC. Advisory Services offered through Cambridge Investment Research Advisors, a Registered Investment Adviser. Strategic Investment Partners and Cambridge are not affiliated. Indices mentioned are unmanaged and cannot be invested into directly. Past performance is no guarantee of future results.