7-26-21 Weekly Market Update
The very Big Picture
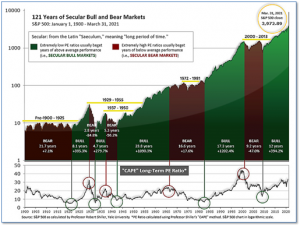
The long-term valuation of the market is commonly measured by the Cyclically Adjusted Price to Earnings ratio, or “CAPE”, which smooths-out shorter-term earnings swings in order to get a longer-term assessment of market valuation. A CAPE level of 30 is considered to be the upper end of the normal range, and the level at which further PE-ratio expansion comes to a halt (meaning that further increases in market prices only occur as a general response to earnings increases, instead of rising “just because”). The market was recently at that level.
Of course, a “mania” could come along and drive prices higher – much higher, even – and for some years to come. Manias occur when valuation no longer seems to matter, and caution is thrown completely to the wind – as buyers rush in to buy first, and ask questions later. Two manias in the last century – the “Roaring Twenties” of the 1920s, and the “Tech Bubble” of the late 1990s – show that the sky is the limit when common sense is overcome by a blind desire to buy. But, of course, the piper must be paid, and the following decade or two were spent in Secular Bear Markets, giving most or all of the mania-gains back.

See Fig. 1 for the 100-year view of Secular Bulls and Bears. The CAPE is now at 38.32, up from the prior week’s 37.99. Since 1881, the average annual return for all ten-year periods that began with a CAPE in the 30-40 range has been slightly negative (see Fig. 2).

Note: We do not use CAPE as an official input into our methods. However, if history is any guide – and history is typically ‘some’ kind of guide – it’s always good to simply know where we are on the historic continuum, where that may lead, and what sort of expectations one may wish to hold in order to craft an investment strategy that works in any market ‘season’ … whether current one, or one that may be ‘coming soon’!
The Big Picture:
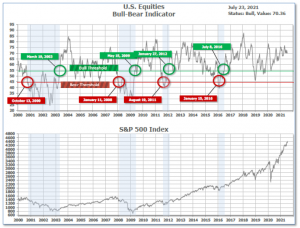
The ‘big picture’ is the (typically) years-long timeframe – the timeframe in which Cyclical Bulls and Bears operate. The U.S. Bull-Bear Indicator is in Cyclical Bull territory at 70.36 up from the prior week’s 69.94.

In the Quarterly- and Shorter-term Pictures
The Quarterly-Trend Indicator based on the combination of U.S. and International Equities trend-statuses at the start of each quarter – was Positive on June 30, indicating positive prospects for equities in the first quarter of 2021.
Next, the short-term(weeks to months) Indicator for US Equities turned negative on July 19 and ended the week at 7, down from the prior week’s 15.

In the Markets:
U.S. Markets: U.S. stocks ended the week higher, rebounding from a sharp sell-off on Monday. The advance was somewhat narrow, with much of the gains concentrated in technology and internet-related giants. The Dow Jones Industrial Average finished the week up 374 points to 35,062—a gain of 1.1%. The technology-heavy NASDAQ Composite powered ahead 2.8% to 14,837. By market cap, the large cap S&P 500 rose 2.0%, while the mid cap S&P 400 and small cap Russell 2000 each rose 2.1%.
International Markets: Canada’s TSX added 1%, while the UK’s FTSE 100 rose for the first time in four weeks adding 0.3%. On Europe’s mainland, France’s CAC 40 and Germany’s DAX gained 1.7% and 0.8%, respectively. Major markets were mixed in Asia; China’s Shanghai Composite added 0.3% while Japan’s Nikkei declined -1.6%. As grouped by Morgan Stanley Capital International, developed markets rose 1.1%, while emerging markets declined -2.0%.
Commodities: Commodities finished the week mixed. Gold retreated after three consecutive weeks of gains declining 0.7% to $1801.80 per ounce, while Silver gave up -2.2% to $25.23 per ounce. Oil rebounded following an early week sell-off. West Texas Intermediate crude oil rose 0.7% to $72.07 per barrel. The industrial metal copper, viewed by some analysts as a barometer of world economic health due to its wide variety of uses, finished the week up 1.8%.
U.S. Economic News: The number of Americans filing first-time unemployment claims jumped to a nine-week high as automakers shut down manufacturing plants to retool for the latest models or, in many cases, due to chip shortages. The Labor Department reported initial jobless claims surged by 51,000 to 419,000 last week. Economists had expected just 348,000 new claims. Analysts noted the increase was concentrated in the few states heavily engaged in automaking and probably doesn’t reflect a broader slowdown in the U.S. economy. The biggest increase took place in Michigan, where autoworkers are eligible for benefits when manufacturing plants are briefly shut down each summer to retool for the latest models. Kentucky and Texas – both big auto-manufacturing states – also reported large increases in new claims. The number of people already collecting state jobless benefits, meanwhile, fell by 29,000 to a seasonally adjusted 3.24 million. These so-called “continuing claims” are consistently falling to new pandemic lows.
Confidence among the nation’s homebuilders continues to wane as shortages of both raw materials and skilled workers continue to hamper construction projects. The National Association of Home Builders (NAHB) reported its monthly confidence index declined 1 point to 80 in July. Economists had been expecting a reading of 81. Robert Dietz, NAHB’s chief economist, said in the report “Builders are contending with shortages of building materials, buildable lots and skilled labor as well as a challenging regulatory environment.” “This is putting upward pressure on home prices and sidelining many prospective home buyers even as demand remains strong in a low-inventory environment,” he added. In the details of the report, the index that gauges the traffic of prospective buyers saw a pronounced decline, dropping six points to 65. Another index, which measures current sales conditions, fell one point to 86, while the index of sales expectations over the next six months actually increased two points to 81.
The U.S. Census Bureau reported its measure of home construction activity continued to improve last month, but homebuilders are facing a challenging market. U.S. home builders started construction on homes at a seasonally-adjusted annual rate of 1.64 million in June, representing a 6.3% increase from the previous month’s downwardly-revised figure, the U.S. Census Bureau reported. Compared with June 2020, housing starts were up 29%, though the year-over-year comparison is skewed by the effects of the COVID-19 pandemic and subsequent lockdowns. However, of concern going forward, the pace of permitting for new homes dipped again in June. Permitting for new homes occurred at a seasonally-adjusted annual rate of nearly 1.6 million, down 5% from May. By region, the Northeast and Midwest both saw declines in housing starts, while the West and South saw gains. The West in particular saw housing starts surge to the highest level since February, with a 13% monthly increase.
After surging higher in the second quarter the U.S. economy cooled a bit, according to data from analytics firm IHS Markit. Markit reported its preliminary composite output index for the U.S. fell to a four-month low of 59.7 in July. That’s down four points from June’s reading. Chris Williamson, chief business economist at IHS Markit stated, “The provisional PMI data for July point to the pace of economic growth slowing for a second successive month, though importantly this cooling has followed an unprecedented growth spurt in May.” IHS Markit said its flash survey of U.S. manufacturers rose slightly to 63.1 in July from 62.1 in the prior month. A similar survey of service-oriented companies — banks, restaurants, retailers and the like — dipped to a five-month low of 59.8 from 64.6 in June. The report noted inflation and short-term capacity issues remain major sources of uncertainty among businesses. Of concern, business optimism about the year ahead fell to the lowest level seen so far this year.
International Economic News: Retail sales in Canada fell in May as economic restrictions to contain a third wave of COVID-19 infections continued in many parts of the country. Statistics Canada reported retail sales declined 2.1% in May to a seasonally-adjusted 53.78 billion CAD. The result exceeded the consensus forecast of a 3.2% decline. TD Bank economist Rishi Sondhi said in a note, “May’s decline in retail spending is no surprise as the country was still in the grips of the third wave. The good news is that provincial re-openings mostly began in June.” Mr. Sondhi said consumer spending is expected to power Canada’s economic growth during the second half of the year, as households spend some of the savings they accumulated when economic restrictions were in place.
Across the Atlantic, Britain’s rapid economic recovery from the coronavirus pandemic slowed sharply in July as a new wave of cases forced thousands of workers to self-isolate under new government rules. IHS Markit reported its composite Purchasing Managers’ Index (PMI) dropped 4.5 points this month to 57.7. While readings above 50 indicate growth in the economy, the reading was the lowest since March and a sharper fall than most economists had forecast. Chris Williamson, chief business economist at IHS Markit, said, “July saw the UK economy’s recent growth spurt stifled by the rising wave of virus infections, which subdued customer demand, disrupted supply chains and caused widespread staff shortages, and also cast a darkening shadow over the outlook.” The economy was still on course to expand in the third quarter, but at a slower pace than before, he added.
On Europe’s mainland, right-leaning activists and members of France’s “yellow vest” movement protested against a bill requiring everyone to have a special virus pass to enter restaurants and other venues and mandating COVID-19 vaccinations for all health care workers. Legislators in France’s Senate were debating the bill after the lower house of parliament approved it, as virus infections are spiking and hospitalizations are rising. The French government is trying to speed up vaccinations to protect vulnerable populations and avoid new lockdowns.
Flooding caused by heavy rains and overflowing rivers has devastated towns across western Germany and taken the lives of over 150 people. German Chancellor Angela Merkel visited Rhineland-Palatinate at the weekend and described the situation as “surreal” and “terrifying.” German Finance Minister Olaf Scholz, who described the extent of the destruction as “immense,” told the Bild am Sonntag newspaper that at least 300 million euros (£353.1 million) of emergency aid would be provided to help in the near term. He pledged billions more for “a reconstruction program so that the destroyed houses, roads and bridges can be quickly repaired.”
The disparities in provincial growth across China widened further during the past six months, with the economies in coastal regions surging ahead on the back of increased exports while northern and inland provinces continued to lag behind. The five major coastal provinces contributed 36.5% of the national output in the first half of the year. China has 31 provincial-level jurisdictions. The results contrast starkly with Beijing’s attempts to balance regional development while cultivating self-sufficient development strategies among individual provinces. They also come as concerns mount over a possible economic slowdown in China later this year, in part because analysts expect export growth to slow.
The costs for hosting the Olympics have only gotten higher for Japan in what should have been an economic windfall for the country. After being awarded the games in 2013, Tokyo pegged the cost of the 2020 Olympics at $7.5 billion. Since then, that number has more than doubled with projections of a $15.4 billion cost forecast in December. Over the past several years, the country worked hard to invest money in building and improving stadiums and readying its infrastructure for the hundreds of thousands of visitors that were expected to flock to Japan to watch their countries compete. However, much of the expected economic benefit from the Tokyo Games vanished in March, when it was decided to ban foreign spectators from traveling to Japan. Now with all spectators banned from the Olympics, what should have been an economic boom for the nation will now assuredly be a bust.
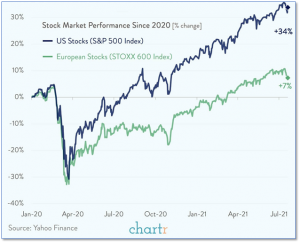
Finally: If you went back in time to the start of 2020 and predicted the stock market would be up almost 35% over the year-and-a-half, most people would have probably believed you. After all, other than a few minor bumps the market had been on a solidly upward trajectory over the last few years. But then a global pandemic, a recession, and an explosion in unemployment claims rocked markets around the world. Since 2011, U.S. markets have sharply outperformed international markets. Would that continue when the market picked itself up and began advancing again? Many forecasters predicted that, at long last, international markets – in particular, European markets – would lead the global recovery in stock markets and finally outperform the U.S. Except it didn’t happen. Once again, U.S. markets took the lead and never looked back, with a 34% advance in the S&P 500 since 1/1/2020, almost 5 times better than the 7% gain in the STOXX 600 European Stock Index. (Chart from chartr.co)

(Sources: All index- and returns-data from Yahoo Finance; news from Reuters, Barron’s, Wall St. Journal, Bloomberg.com, ft.com, guggenheimpartners.com, zerohedge.com, ritholtz.com, markit.com, financialpost.com, Eurostat, Statistics Canada, Yahoo! Finance, stocksandnews.com, marketwatch.com, wantchinatimes.com, BBC, 361capital.com, pensionpartners.com, cnbc.com, FactSet.) Securities offered through Registered Representatives of Cambridge Investment Research Inc., a broker-dealer, member FINRA/SIPC. Advisory Services offered through Cambridge Investment Research Advisors, a Registered Investment Adviser. Strategic Investment Partners and Cambridge are not affiliated. Indices mentioned are unmanaged and cannot be invested into directly. Past performance is no guarantee of future results.
