
9-27-2021 Weekly Market Update
The very Big Picture
The long-term valuation of the market is commonly measured by the Cyclically Adjusted Price to Earnings ratio, or “CAPE”, which smooths-out shorter-term earnings swings in order to get a longer-term assessment of market valuation. A CAPE level of 30 is considered to be the upper end of the normal range, and the level at which further PE-ratio expansion comes to a halt (meaning that further increases in market prices only occur as a general response to earnings increases, instead of rising “just because”). The market was recently at that level.
Of course, a “mania” could come along and drive prices higher – much higher, even – and for some years to come. Manias occur when valuation no longer seems to matter, and caution is thrown completely to the wind – as buyers rush in to buy first, and ask questions later. Two manias in the last century – the “Roaring Twenties” of the 1920s, and the “Tech Bubble” of the late 1990s – show that the sky is the limit when common sense is overcome by a blind desire to buy. But, of course, the piper must be paid, and the following decade or two were spent in Secular Bear Markets, giving most or all of the mania-gains back.
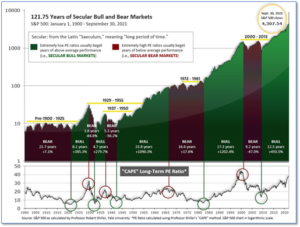
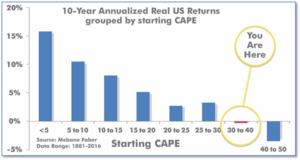
See Fig. 1 for the 100-year view of Secular Bulls and Bears. The CAPE is now at 38.48. Since 1881, the average annual return for all ten-year periods that began with a CAPE in the 30-40 range has been slightly negative (see Fig. 2).
Note: We do not use CAPE as an official input into our methods. However, if history is any guide – and history is typically ‘some’ kind of guide – it’s always good to simply know where we are on the historic continuum, where that may lead, and what sort of expectations one may wish to hold in order to craft an investment strategy that works in any market ‘season’ … whether current one, or one that may be ‘coming soon’!
The Big Picture:
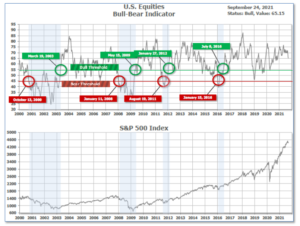
The ‘big picture’ is the (typically) years-long timeframe – the timeframe in which Cyclical Bulls and Bears operate. The U.S. Bull-Bear Indicator is in Cyclical Bull territory at 66.30, down from the prior week’s 69.23.
In the Quarterly- and Shorter-term Pictures
The Quarterly-Trend Indicator based on the combination of U.S. and International Equities trend-statuses at the start of each quarter – was Positive on June 30, indicating positive prospects for equities in the first quarter of 2021.
Next, the short-term(weeks to months) Indicator for US Equities turned negative on September 17 and ended the week at 6, down from the prior week’s 14.
In the Markets:
U.S. Markets: The major U.S. indexes overcame an early week sell-off, ending the week essentially flat to modestly higher. On Monday, the benchmark S&P 500 index recorded its biggest daily drop since early May. The Dow Jones Industrial Average rose 213 points last week finishing at 34,798—a gain of 0.6%. The technology-heavy NASDAQ Composite remained essentially flat, adding just 4 points to close at 15,048. By market cap, the large cap S&P 500 rose 0.5%, while the mid cap S&P 400 added 0.8% and the small cap Russell 2000 finished the week up 0.5%.
International Markets: Canada’s TSX retreated -0.4%, its third consecutive decline, while in Europe the United Kingdom’s FTSE 100 rebounded 1.3%. France’s CAC 40 rose 1%, while Germany’s DAX added 0.3%. In Asia, China’s Shanghai Composite ended the week flat, Japan’s Nikkei declined -0.8%. As grouped by Morgan Stanley Capital International, developed markets declined -0.2%, while emerging markets fell -1.1%.
Commodities: Major commodities finished the week in the green. Gold rose slightly, 0.02%, to $1751.70 per ounce, while Silver rose 0.4% to $22.43. Oil rose for a fifth consecutive week. West Texas Intermediate crude oil gained 3% to $73.98 per barrel. The industrial metal copper, viewed by some analysts as a barometer of world economic health due to its wide variety of uses, finished the week up 0.9%.
U.S. Economic News: The number of Americans filing first-time unemployment benefits spiked to a one-month high, but the increase appeared to stem largely from California catching up on a backlog of claims, rather than any deterioration in the U.S. economy. The Labor Department reported initial jobless claims rose by 16,000 to 351,000 in the week ended September 18th. Economists had estimated new claims would total 320,000. Earlier this month, claims had tumbled to a pandemic-era low of 312,000. Before the pandemic claims were consistently in the low 200,000’s. Continuing claims, which counts the number of people already receiving benefits, rose by 131,000 to 2.85 million. This number had fallen to a pandemic low the prior week.
Confidence among the nation’s homebuilders improved this month as demand for housing remained strong. The National Association of Home Builders (NAHB) reported its monthly confidence index increased one point to 76 in September. The uptick comes following three months of declines in optimism among home builders. In the details, the index measuring traffic of prospective buyers notched the largest gain rising two points to 61. The gauge of current sales conditions rose a point to 82. Expectations of future sales over the next six months remained even at 81. Analysts noted the housing market, while off its highs, remains robust. Robert Dietz, chief economist for the NAHB stated in the release, “The single-family building market has moved off the unsustainably hot pace of construction of last fall and has reached a still hot but more stable level of activity.”
The Census Bureau reported home builders started construction on homes at a seasonally-adjusted annual rate of 1.62 million in August—a 3.9% increase from the previous month. Compared with the same time last year, housing starts were up 17.4%. Economists had expected housing starts to occur at a 1.55 million rate. The gains in August were driven primarily by an uptick in the higher-margin multifamily (apartments and condominiums) sector. Multifamily starts rose by nearly 22%, whereas single-family starts decreased by roughly 3% on a monthly basis. Notably, the report showed there were nearly 20% more permits issued for multifamily projects in August as compared with July, but only 0.6% more single-family homes. Part of the reason builders are focused on more expensive projects is the high costs they continue to endure. Although lumber prices have dropped from their peak reached earlier this year, the cost of other building materials and labor remain especially high.
Sales of existing homes declined last month as buyers held out for better prices and more options. The National Association of Realtors (NAR) reported home sales dropped 2% in August, as inventory and price remained major concerns for prospective buyers. Compared with the same time last year, sales were down 1.5%. Lawrence Yun, chief economist for the NAR noted in the report that buyers, “are out and about searching, but much more measured about their financial limits, and simply waiting for more inventory.” The median sales price of an existing home was up nearly 15% year-over-year at $356,700. Expressed in terms of the months’ supply, there was a 2.6-month supply of homes based on the current pace of sales, unchanged from July. A six-month supply of homes is generally considered a “balanced” market.
The U.S. economy is still powering ahead despite a reported spread of the “delta-variant” of the coronavirus according to analytics firm IHS Markit. Business leaders at U.S. manufacturing and services companies are still optimistic about the near future the surveys showed. However, both sectors reported the inability to find qualified workers or get badly needed supplies continued to pose major roadblocks. The preliminary “flash” reading of Markit’s services index slid 1.1 points to a 14-month low of 54.4 this month, while the firm’s manufacturing index also dipped to a five-month low of 60.5 from 61.1. Despite the declines, analysts were still optimistic. Readings above 50 signify growth and anything above 60 are especially robust.
The Federal Reserve signaled this week it is almost ready to begin tapering its bond-buying program and is considering moving up its timetable for raising interest rates. Chairman Jerome Powell said the Fed could “easily move” in November to announce its scaling back its bond purchases if the economy continues to make further progress. He also noted that inflation now sharply exceeds the Fed’s 2% target, though he stuck to his view that inflation is “transitory”. He said Fed officials think it’s appropriate for the tapering program to be gradual and end “around the middle of next year.” The Fed has been buying $80 billion in Treasuries and $40 billion in mortgage-backed securities each month since last summer to keep long-term interest rates low and spur demand as the economy recovered from the coronavirus pandemic.
International Economic News: Economists warned Canada’s Prime Minister Justin Trudeau risked further fueling Canada’s already hot inflation if he presses ahead with the spending plans outlined during his election campaign. Trudeau’s liberal party pledged C$78 billion ($61.6 billion USD) in new spending over the next 5 years—about 4% of Canada’s gross domestic product. That would be on top of the C$101 billion in extra spending over three years passed earlier this year. Tony Stillo, director of Canada economics at Oxford Economics wrote, “When you start to see this sort of stimulus hitting the economy … we think it could prompt the Bank of Canada to respond.” In August, Canada’s inflation rate accelerated to its highest level in 18 years at 4.1%–well above the BOC’s 1-3% target.
Across the Atlantic, economic growth in the United Kingdom slowed to its weakest level since COVID rules were eased in March. Like much of the rest of the world, severe shortages of workers and supplies dragged down economic growth in Britain. The latest reading from IHS Markit and the Chartered Institute of Procurement and Supply showed growth in the private sector slowed in September as firms experienced severe shortages while costs rose at their fastest pace since the late 1990’s. The Markit/CIPS flash PMI dropped 0.7 point to 54.1 this month. Economists had been expecting a reading of 54.5. Business expectations for the year ahead fell to their lowest since January, while new orders fell to a 7-month low.
On Europe’s mainland, Germany’s Ifo Economic Institute cut its growth forecast for Europe’s largest economy for this year over disruptions in the supply chain and the scarcity of semiconductor chips and other intermediate goods. The institute now sees Germany’s GDP growing 2.5% this year, down 0.8% from its previous forecast. The weaker-than-expected growth forecast also shows Germany’s next government will inherit a still-fragile recovery from Chancellor Angela Merkel who is stepping down this month after 16 years in power. Ifo chief economist Timo Wollmershaeuser said in the report, “The strong recovery from the coronavirus crisis, originally expected for the summer, is further postponed.”
In Asia, the massive Chinese property developer, Evergrande Group, continued on the brink of default this week, sending fears through financial markets that a collapse could trigger a chain reaction. The developer said this week it had reached a deal that would give it some short-term liquidity to pay its short-term debt obligations. However, some analysts believe Evergrande’s problems could be just a symptom of a broader threat to China’s economy. They note China’s growth is demonstrably slowing, with retail sales much weaker than expected last month, industrial production down and property developers sharply reducing new housing projects.
The Bank of Japan maintained a status quo on its key short-term interest rates and issued a bleak commentary on factory output and exports. The BOJ kept its short-term interest rate target at -0.1% while the yield for the 10-year government bond was kept at around 0%. The central bank warned that the employment and income situation remained weak due to COVID, while private consumption remained stagnant due to sustained downward pressure on services consumption. The weaker readings weighed on sentiment; however they reinforced the belief that Japan may not follow its global peers in pursuing a rollback of pandemic-era stimulus measures.
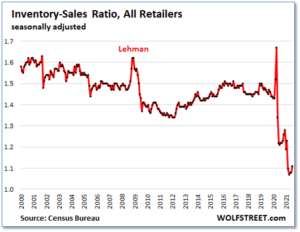
Finally: Most people haven’t even begun to think about doing their Christmas shopping; after all it isn’t even Halloween. But maybe you should. Retailers attempting to stock up for the holiday selling season are facing all kinds of shortages, transportation chaos, and surging prices. As analysts at WolfStreet.com point out, the inventory-to-sales ratio (inventories divided by sales, a standard metric of supply, which cancels out the impact of inflation) started collapsing last year. In May, the ratio hit an all-time low in the data going back to 1992, and has only regained a small amount since. Memories of 80’s era fistfights over Cabbage Patch Kids dolls come to mind… (Chart by WolfStreet.com)
(Sources: All index- and returns-data from Yahoo Finance; news from Reuters, Barron’s, Wall St. Journal, Bloomberg.com, ft.com, guggenheimpartners.com, zerohedge.com, ritholtz.com, markit.com, financialpost.com, Eurostat, Statistics Canada, Yahoo! Finance, stocksandnews.com, marketwatch.com, wantchinatimes.com, BBC, 361capital.com, pensionpartners.com, cnbc.com, FactSet.) Securities offered through Registered Representatives of Cambridge Investment Research Inc., a broker-dealer, member FINRA/SIPC. Advisory Services offered through Cambridge Investment Research Advisors, a Registered Investment Adviser. Strategic Investment Partners and Cambridge are not affiliated. Indices mentioned are unmanaged and cannot be invested into directly. Past performance is no guarantee of future results.