
7-22-19 Weekly Market Update
The Very Big Picture:
The long-term valuation of the market is commonly measured by the Cyclically Adjusted Price to Earnings ratio, or “CAPE”, which smooths out shorter-term earnings swings in order to get a longer-term assessment of market valuation. A CAPE level of 30 is considered to be the upper end of the normal range, and the level at which further PE-ratio expansion comes to a halt (meaning that increases in market prices only occur in a general response to earnings increases, instead of rising “just because”). The market is currently at that level.
Of course, a “mania” could come along and drive prices higher – much higher, even – and for some years to come. Manias occur when valuation no longer seems to matter, and caution is thrown completely to the wind as buyers rush in to buy first and ask questions later. Two manias in the last century – the 1920’s “Roaring Twenties” and the 1990’s “Tech Bubble” – show that the sky is the limit when common sense is overcome by a blind desire to buy. But, of course, the piper must be paid and the following decade or two are spent in Secular Bear Markets, giving most or all of the mania gains back.
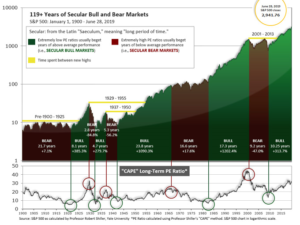
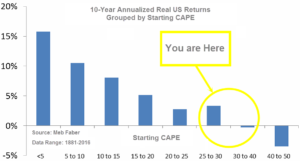
See Fig. 1 for the 100-year view of Secular Bulls and Bears. The CAPE is now at 30.36, down from the prior week’s 30.73, above the level reached at the pre-crash high in October, 2007. Since 1881, the average annual return for all ten year periods that began with a CAPE around this level have been in the 0% – 3%/yr. range. (see Fig. 2).
In the Big Picture:
The “big picture” is the months-to-years timeframe – the timeframe in which Cyclical Bulls and Bears operate. The U.S. Bull-Bear Indicator (see Fig. 3) is in Cyclical Bull territory at 62.85, down from the prior week’s 64.25.

In the intermediate and Shorter-term picture:
The Shorter-term (weeks to months) Indicator (see Fig. 4) turned positive on June 4th. The indicator ended the week at 23, up from the prior week’s 22. Separately, the Intermediate-term Quarterly Trend Indicator – based on domestic and international stock trend status at the start of each quarter – was positive entering July, indicating positive prospects for equities in the third quarter of 2019.

Timeframe summary:
In the Secular (years to decades) timeframe (Figs. 1 & 2), the long-term valuation of the market is historically too high to sustain rip-roaring multi-year returns. The Bull-Bear Indicator (months to years) remains positive (Fig. 3), indicating a potential uptrend in the longer timeframe. In the intermediate timeframe, the Quarterly Trend Indicator (months to quarters) is positive for Q3, and the shorter (weeks to months) timeframe (Fig. 4) is positive. Therefore, with three indicators positive and none negative, the U.S. equity markets are rated as Positive.
In the Markets:
U.S. Markets: The major U.S. indexes finished the week lower as the second-quarter earnings season began in earnest. The narrowly focused Dow Jones Industrial Average managed the best return by declining just -0.7%, while the technology-heavy NASDAQ Composite finished down -1.2%. By market cap, the large cap S&P 500 and mid cap S&P 400 each retreated -1.2%, while the small cap Russell 2000 was off -1.4%.
International Markets: Canada’s TSX finished essentially flat, down just -0.01%. Across the Atlantic, the United Kingdom’s FTSE managed a slight 0.04% gain. On Europe’s mainland France’s CAC 40 was off -0.4%, Germany’s DAX retreated -0.5%, and Italy’s Milan FTSE slumped -2.4%. In Asia, China’s Shanghai Composite finished down ‑0.2% while Japan’s Nikkei gave up -1.0%. As grouped by Morgan Stanley Capital International, developed markets finished down -0.4%, while emerging markets gained a tiny 0.02%.
Commodities: Precious metals managed a second week of gains with gold adding 1.0% to close at $1426.70 an ounce. Silver, trying to catch up to gold’s recent jump, surged 6.3% to finish the week at $16.19 an ounce. In energy, crude oil reversed all of last week’s gain, giving up -7.4% and closing at $59.55 per barrel of West Texas Intermediate crude oil. The industrial metal copper, viewed by some analysts as a barometer of global economic health due to its wide variety of uses, gained 2.2%.
U.S. Economic News: The number of Americans filing for first-time unemployment benefits rose by 8,000 last week to 216,000, the Labor Department reported. That reading remains well below the key 300,000 threshold analysts use to indicate a “healthy” jobs market. Economists had estimated new claims would total a seasonally-adjusted 221,000. The less-volatile four-week average of new claims declined by 250 to 218,750. The four-week average usually gives a better read of labor market conditions than the more jumpy weekly number. Continuing claims, which counts the number of people already receiving benefits, fell by 42,000 to 1.69 million. The last time continuing claims were this low was in the early 1970’s.
Confidence among the nation’s homebuilders rose earlier this month, but still lagged from the same time last year. The National Association of Home Builders (NAHB) builder sentiment index rose one point to 65 in July, matching economists’ forecasts. In the details of the report, the readings of current sales conditions and expectations for the next six months each rose a point to 72 and 71, respectively. However, the index that tracks buyer traffic remained below the neutral line at 48. At a reading of 65, the headline index is much higher than the 58 level at which it began the year. But the year-to-date average is 63 is still below last year’s 67, and 68 in 2017.
The number of new homes under construction fell slightly last month and the number of permits sank to the lowest level in two years, suggesting lower mortgage rates haven’t boosted the housing market as much as anticipated. The Commerce Department reported that housing starts slipped 0.9% to an annual pace of 1.25 million last month, slightly exceeding economists’ forecasts of a reading of 1.24 million. In addition, the number of permits to build new homes sank 6.1% to a 1.22 million annual pace. That’s the lowest level since mid-2017. By region, housing starts rose in the Northeast and the Midwest, however they slowed in the South and the West. In the details, single-family house construction rose by 3.5% and accounted for 68% of the new starts, while work on multi-family projects of five or more units slipped after soaring to an 18-month high in May.
The University of Michigan’s Consumer Sentiment Index edged up this month, remaining near a 15-year high. The index edged up 0.2 points to 98.4 even in the face of rising economic headwinds. Economists had forecast a reading of 99.0. In the details, the gauge that measures what consumers think about their own financial situation slipped 0.8 point to 111.1, but the measure that surveyed expectations for the next six months advanced to 90.1 from 89.3. Consumer spending represents about 70% of what happens in the U.S. economy and Americans have plenty of reasons to feel good. Incomes are rising, layoffs and unemployment are near a 50-year low and plenty of jobs are available.
Sales at the nation’s retailers rose for the fourth consecutive month, suggesting that the economy is not as fragile as the media (and apparently the Federal Reserve) believe. The Commerce Department reported retail sales increased 0.4% in June, exceeding economists’ expectations of a 0.1% gain. Stripping out fuel sales, the increase was even larger – up 0.7% – as falling oil prices caused a big drop in sales at gas stations. In the details, internet retailers led the way with a 1.7% increase in sales, with restaurants, grocers, home-furnishing stores, and clothing outlets also gaining.
In New York State, manufacturing activity rebounded out of negative territory back into expansion. The Federal Reserve Bank of New York’s Empire State Survey rose 12.9 points to 4.3 in July, vs economists’ expectations of a reading of 0.5. The gain partially reversed June’s steep plunge to -8.6, its lowest level since October 2016. In the new details, the subcomponents were mixed. New orders rose in July but remained in negative territory at -1.5, while the shipments index moved lower to 7.2. The index for number of employees slid to its lowest level in almost three years. The outlook for growth in the next six months improved slightly, but remained notably weaker than in late 2017 and early 2018.
In the city of ‘Brotherly Love’, manufacturing rebounded to its highest reading in a year, according to the Federal Reserve Bank of Philadelphia. The Philly Fed said its gauge of business activity in its region rebounded strongly in July after hitting its lowest level in four months in June. The bank’s index rose to 21.8 in July from just 0.3 in June. Economists had expected a reading of just 4.5. In the details, the barometer of new orders increased 11 points to 18.9, while the shipments index added 8 points to 24.9. The measure for “outlook over the next 6 months” rose 17 points to 38. In an answer to a special question, 51% of the manufacturers surveyed said they have seen a “modest” increase in demand for their products over recent months.
The Federal Reserve reported that nationwide activity in the U.S. factory sector declined in the second quarter, its second straight quarterly decline. After a -1.9% decline in the first quarter, the second quarter saw a further ‑2.2% decline. Federal Reserve Chairman Jerome Powell cited the weak factory sector as one reason policymakers support cutting interest rates. Ian Shepherdson, chief economist at Pantheon Macroeconomics stated, “The sector is in recession. That’s not news; it’s a consequence of China’s cyclical slowdown and the trade war. We expect another tough quarter in Q3, but by Q4 we think a trade deal will have been done and China’s economy will be turning up.”
International Economic News: Canada’s economic outlook is generally positive, according to the Bank of Canada’s July Monetary Report. The report confirmed assertions by the government that the economy continues to be supported by solid job and wage growth. In the report, GDP growth is expected to increase from 1.3% this year to about 2% in 2020 and 2021. Furthermore, growth in the economy is expected to be broad-based with investment and exports projected to expand and consumer spending to grow steadily. The report notes that the most important risks to the Canadian economy are related to global trade policies. While the lifting of tariffs with the U.S. has been positive, “recent actions by China are concerning”, the report states.
The United Kingdom’s Office of Budget Responsibility (OBR) warned this week that leaving the European Union this year without a Brexit deal would plunge the UK into a recession. The OBR warned that “heightened uncertainty and declining confidence” would deter investment while higher trade barriers would slam exports. The government’s budget watchdog stated a no-deal Brexit would “push the economy into recession, with asset prices and the pound falling sharply.” The OBR estimated the UK’s stock markets would fall 5% while the pound would drop 10%. In addition, it estimated GDP would shrink by 2% by the end of 2020. The report is a stark warning ahead of the latest October 31 deadline for Britain to leave the EU.
Investor confidence in Germany’s economic outlook fell for a third straight month, the ZEW research institute reported. The institute’s indicator for economic sentiment fell a further 3.4 points to -24.5 following a significant 19 point plunge in June. The assessment of the current economic situation recorded its first negative reading since 2010 at -1.1 for July. ZEW President Achim Wambach stated persistent trade pressures between the U.S. and China have had a cascading effect weighing on attitudes towards the German economy. He said: “In particular the continued negative trend in incoming orders in the German industry is likely to have reinforced the financial market experts’ pessimistic sentiment.” Recent conflict between the US and Iran and a lack of direction from ongoing Brexit negotiations have served to further exacerbate bearish sentiment.
China’s economy grew at its slowest pace in 27 years in the last quarter as the trade war with the United States continued to take a toll. The second-largest economy in the world grew an annualized 6.2% in the second quarter of 2019, down from 6.4% in the first, according to data released by the Chinese government. The pace of growth was its slowest since 1992. Mao Shengyong, spokesperson for China’s National Bureau of Statistics, told reporters that the “external environment” was more complicated than in the past. Despite the decline, the reading remained within the target range set by the government of 6.0%-6.5% annual growth. Domestic spending by Chinese consumers kept the economy from slowing further, the report said.
Japan’s exports fell for a seventh consecutive month in June, Japan’s Ministry of Finance reported, dragged down by declining sales of tankers, China-bound car parts and steel pipes. Exports from the world’s third-largest economy fell 6.7% from a year earlier, compared with a 7.8% fall in May. Economists had expected a 5.6% decline. Analysts blamed the usual suspects of China-U.S. trade frictions, slowing Chinese growth, and rising trade protectionism. In addition, they don’t see any resolution in the near future. Robert Subbaraman, chief economist and head of global markets research, Asia ex-Japan at Nomura, wrote, “The export picture should remain bleak in coming months.”
Finally: With the 50th anniversary of the US landing on the moon, all kinds of remembrances of that momentous day in 1969 have flooded the media. Here’s one of the more unique lookbacks: Craig Johnson, Chief Market Technician at Piper Jaffray noted this week that had you purchased shares of McDonalds, Lowe’s, Altria, Hasbro and Disney on the day that Neil Armstrong declared, “That’s one small step for man, one giant leap for mankind” you would have made a truly “out of this world” return! Since July 1969, McDonalds has skyrocketed 82,000%, Lowe’s 70,000%, Altria 49,000%, Hasbro 43,000%, and Disney 40,000%.

(Sources: all index return data from Yahoo Finance; Reuters, Barron’s, Wall St Journal, Bloomberg.com, ft.com, guggenheimpartners.com, zerohedge.com, ritholtz.com, markit.com, financialpost.com, Eurostat, Statistics Canada, Yahoo! Finance, stocksandnews.com, marketwatch.com, wantchinatimes.com, BBC, 361capital.com, pensionpartners.com, cnbc.com, FactSet) These are the opinions of WE Sherman and Co and not necessarily those of Cambridge, are for informational purposes only, and should not be construed or acted upon as individualized investment advice.
Securities offered through Registered Representatives of Cambridge Investment Research Inc., a broker-dealer, member FINRA/SIPC. Advisory Services offered through Cambridge Investment Research Advisors, a Registered Investment Adviser. Strategic Investment Partners and Cambridge are not affiliated.
Indices mentioned are unmanaged and cannot be invested into directly. Past performance is no guarantee of future results. All Investing involves risk. Depending on the types of investments, there may be varying degrees of risk. Investors should be prepared to bear loss, including total loss of principal.