
7-29-19 Weekly Market Update
The Very Big Picture:
The long-term valuation of the market is commonly measured by the Cyclically Adjusted Price to Earnings ratio, or “CAPE”, which smooths out shorter-term earnings swings in order to get a longer-term assessment of market valuation. A CAPE level of 30 is considered to be the upper end of the normal range, and the level at which further PE-ratio expansion comes to a halt (meaning that increases in market prices only occur in a general response to earnings increases, instead of rising “just because”). The market is currently at that level.
Of course, a “mania” could come along and drive prices higher – much higher, even – and for some years to come. Manias occur when valuation no longer seems to matter, and caution is thrown completely to the wind as buyers rush in to buy first and ask questions later. Two manias in the last century – the 1920’s “Roaring Twenties” and the 1990’s “Tech Bubble” – show that the sky is the limit when common sense is overcome by a blind desire to buy. But, of course, the piper must be paid and the following decade or two are spent in Secular Bear Markets, giving most or all of the mania gains back.
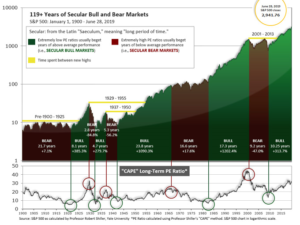
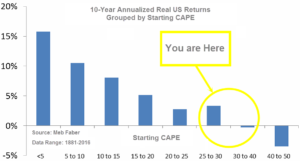
See Fig. 1 for the 100-year view of Secular Bulls and Bears. The CAPE is now at 30.86, up from the prior week’s 30.36, above the level reached at the pre-crash high in October, 2007. Since 1881, the average annual return for all ten year periods that began with a CAPE around this level have been in the 0% – 3%/yr. range. (see Fig. 2).
In the Big Picture:
The “big picture” is the months-to-years timeframe – the timeframe in which Cyclical Bulls and Bears operate. The U.S. Bull-Bear Indicator (see Fig. 3) is in Cyclical Bull territory at 63.77, up from the prior week’s 62.85.

In the Intermediate and Shorter-term Picture:
The Shorter-term (weeks to months) Indicator (see Fig. 4) turned positive on June 4th. The indicator ended the week at 26, up from the prior week’s 23. Separately, the Intermediate-term Quarterly Trend Indicator – based on domestic and international stock trend status at the start of each quarter – was positive entering July, indicating positive prospects for equities in the third quarter of 2019.

Timeframe summary:
In the Secular (years to decades) timeframe (Figs. 1 & 2), the long-term valuation of the market is historically too high to sustain rip-roaring multi-year returns. The Bull-Bear Indicator (months to years) remains positive (Fig. 3), indicating a potential uptrend in the longer timeframe. In the intermediate timeframe, the Quarterly Trend Indicator (months to quarters) is positive for Q3, and the shorter (weeks to months) timeframe (Fig. 4) is positive. Therefore, with three indicators positive and none negative, the U.S. equity markets are rated as Positive.
In the Markets:
U.S. Markets: U.S. stocks rebounded from last week’s losses and turned higher as the large-cap S&P 500 and technology-heavy NASDAQ Composite surged to record highs. The Dow Jones Industrial Average retraced some of last week’s decline rising 38 points to finish the week at 27,192. The NASDAQ Composite rallied 183 points to 8,330, a gain of 2.3%. By market cap, the large cap S&P 500 rose 1.7%, while the mid cap S&P 400 and small cap Russell 2000 rose 2.4% and 2.0% respectively.
International Markets: Canada’s TSX rose 0.3% while across the Atlantic the United Kingdom’s FTSE gained 0.5%. On Europe’s mainland France’s CAC 40 rose 1.0% while Germany’s DAX added 1.3% and Italy’s Milan FTSE rose 0.9%. In Asia, China’s Shanghai Composite added 0.7% and Japan’s Nikkei added 0.9%. As grouped by Morgan Stanley Capital International, developed markets were essentially flat at -0.02%, while emerging markets were off ‑0.4%.
Commodities: Gold took a break from its recent rally by closing down -0.5% to $1419.30 an ounce. Silver continued to rally for a third consecutive week, adding 1.3% and finishing the week at $16.40 per ounce. Crude oil finished the week fractionally up as West Texas Intermediate gained 0.8% to close at $56.20 per barrel. The industrial metal copper, viewed by analysts as a barometer of global economic health due to its wide variety of uses, finished the week down -2.5%.
U.S. Economic News: The Labor Department reported the number of Americans applying for first-time unemployment benefits last week fell by 10,000 to 206,000–its lowest level in more than three months. Economists had estimated new claims would total a seasonally-adjusted 218,000. The less-volatile monthly average of new claims declined a smaller 5,750 to 213,000. Continuing claims, which counts the number of people already receiving benefits, fell by 13,000 to 1.68 million. That number is near its lowest level since the early 1970’s.
Sales of previously owned homes slipped 1.7% last month, reflecting the continued weakness in the U.S. housing market despite a sharp drop in mortgage rates. The National Association of Realtors reported existing homes sold at a 5.27 million annualized pace last month, down from the 5.36 million pace in May. Economists had expected a smaller decline to a 5.33 million rate. Compared to the same time last year, sales are down 2.2%. Although sales are down, prices are up. The median selling price in June rose 4.3% to $285,700 from the same time last year. By region, sales increased 1.5% in the Northeast and 1.6% in the Midwest. Sales were down 3.4% in the South and off 3.5% in the West. Jennifer Lee, senior economist at BMO Capital Markets noted that the results, while not spectacular—weren’t necessarily bad either. Lee stated “The housing sector is struggling to break higher despite lower borrowing costs and steady income growth. Given the alternative — think of 2009 — steadyish growth isn’t that bad.”
After two consecutive months of declines new home sales rebounded last month by rising 7%, the Commerce Department reported. The annual sales pace for new single-family homes rose to 646,000 in June. Economists had expected a sales rate of 657,000. New home sales peaked at a high of 693,000 in March. Over the past year, sales were 4.5% higher than the same time last year. The median sales price was $310,400 in June, slightly lower than the same time last year. At the current sales pace, it would take 6.3 months to exhaust the available supply—slightly above the six months generally considered to be an evenly balanced housing market.
Manufacturing in the U.S. expanded at its slowest pace in almost 10 years as weakness from Europe and Asia appears to have hit U.S. shores. Economists say ongoing trade disputes are exacerbating the problem. Research firm IHS Markit reported its manufacturing Purchasing Managers’ Index slid 0.6 points to 50 this month, marking its lowest level since September of 2009. The index number of 50 is the cutoff point between expansion and contraction. However, a similar survey of the much larger services side of the economy rose to a three-month high of 52.2. Some 80% of Americans work in the service sector. Chris Williamson, chief business economist at IHS Markit addressed the apparent dichotomy stating, “The overall picture of modest growth conceals a two-speed economy, with steady service sector growth masking a deepening downturn in the manufacturing sector.”
Orders for goods expected to last at least 3 years, so-called ‘durable goods’, rebounded for the first time in three months, the Commerce Department reported. Orders for long-lasting manufactured goods rose 2% last month, higher than the 0.7% increase economists had expected. Stripping out transportation, orders rose a smaller 1.2%. Analysts often look at orders minus vehicles and planes as transportation can be especially volatile month to month. Almost all of the major categories saw orders increase. The only major category to suffer a decline was defense, which dropped 32%. A key measure of business investment, known as core orders, rose 1.9% to mark its biggest gain in almost a year and a half. Chief economist Chris Low of FTN Financial stated, “Weak business/fixed investment is the economy’s primary vulnerability, and this report suggests it is not nearly as vulnerable as it appeared a month ago.”
The country’s Gross Domestic Product slowed to 2.1% in the second quarter, but the growth was still better than Wall Street estimates of a 2.0% gain. The Commerce Department reported tariffs and a global slowdown weighed on the U.S. economy as the GDP slowed from the first quarter’s 3.1% growth. Analysts noted the underlying numbers looked good and appeared to lessen fears of a recession that have been much of the talk among economists and policymakers at the Federal Reserve. Michael Arone, chief investment strategist at State Street Global Advisors stated, “The recession talk was always overstated. The economic data continue to suggest that the economy isn’t near recession, at least in the next year or so.” President Trump deemed the report “not bad” and noted that growth was continuing despite what he considers overly tight monetary policy from the Federal Reserve.
International Economic News: Canadian research firm C.D. Howe Institute reported that Canada’s dairy and agriculture will be the biggest losers under the U.S. President Donald Trump’s new NAFTA deal. The report notes that the U.S. will be the biggest beneficiary of the revamped tripartite North American deal with both Canada and Mexico expected to lose revenue, exports, investments, and economic welfare of its citizens. Canada’s economy could shrink by 0.4% and economic welfare will decline by more than US$10 billion, the report notes. In terms of sector impacts, Canada’s dairy sector will be hardest hit, “where shipments decline both due to the ceding of market share to U.S. dairy imports and to declining domestic demand from the macroeconomic consequences of the agreement.” Manufacturing, however, is expected to see a slight (0.02%) increase in shipments.
The British pound strengthened, hitting a three week high vs the euro as Boris Johnson became the new British Prime Minister. Johnson won the race to lead the ruling Conservative Party and vowed to implement the result of the 2016 Brexit referendum and lead Britain out of the European Union on October 31 with “no ifs or buts”. Mr. Johnson, a former mayor of London and U.K. foreign secretary, will run a minority government that can muster a very slight majority in Parliament with the help of a small Northern Irish party. His tenure will almost certainly be defined by Brexit, one of the greatest political challenges faced by any British prime minister since World War II and one that ended the careers of his two immediate predecessors.
U.S President Donald Trump vowed swift retaliation against France for imposing a tax on digital transactions that would hurt U.S. technology companies. In a tweet on Friday, Mr. Trump addressed French President Emmanuel Macron, and warned that punitive measures were on their way. “We will announce a substantial reciprocal action on Macron’s foolishness shortly. I’ve always said American wine is better than French wine!” Trump tweeted. France enacted its own digital tax after years of frustration with the ability of US technology groups to avoid paying large tax bills in Europe, despite generating big revenues in many countries.
German business morale plunged to its lowest level in more than 6 years, according to the Ifo Institute. The report is a further sign that a manufacturing crisis is taking hold in Europe’s economic powerhouse. The Ifo institute said its business climate index fell to 95.7 from an upwardly revised 97.5 in June. The July reading missed the consensus forecast for 97.1. It was the fourth monthly decline in a row and the lowest level since April 2013. Weaker foreign demand, trade disputes, and the uncertainty surrounding Brexit are weighing on Germany’s export-reliant economy particularly heavily. VP Bank analyst Thomas Gitzel stated, “The most important German economic indicator suggests that the German economy is heading toward a recession.”
Profits earned by China’s industrial firms fell 3.1% last month from the same time a year earlier, China’s National Bureau of Statistics reported. Profits of China’s industrial companies have been softening since the second half of 2018 as the economy slowed and producer prices weakened. Many industrial firms have put off investment decisions and scaled back manufacturing investments as global trade tensions continue to escalate. U.S. and Chinese negotiators will meet early this coming week for the first time since their presidents, Donald Trump and Xi Jinping, agreed in late June to revive talks in a bid to end the year-long trade war.
Japan’s government retained its view that the economy is recovering at a moderate pace while saying that weakness continued to center on exports, according to a monthly economic report for July released by the Cabinet Office this week. Risks to the outlook posed by weaker overseas demand could add to pressure on the government to boost spending in order to counter a potential blow to demand from a scheduled sales tax hike this fall. On the positive side, the government lifted its assessment of industrial output for the first time in more than a year-and-a-half, raising it to “flat” from “weak”. The improvement stemmed mainly from strength in car production and construction machinery, an official said, adding the government remained cautious over the outlook for industry.
Finally: Mutual fund giant Vanguard recently released its 2019 edition of “How America Saves”. Notably, the retirement balances of 401k plan participants aged 55 to 64, a group fast approaching retirement, have median account balances that are actually lower than the median balances of those in the same age cohort twelve years ago in 2007. Despite many alarm bells being rung over the last 12 years about the frightening inadequacy of retirement savings, it doesn’t appear that 401k participants closest to retirement have acted to improve their retirement readiness. (Chart from the Center for Retirement Research using Vanguard data)

(Sources: all index return data from Yahoo Finance; Reuters, Barron’s, Wall St Journal, Bloomberg.com, ft.com, guggenheimpartners.com, zerohedge.com, ritholtz.com, markit.com, financialpost.com, Eurostat, Statistics Canada, Yahoo! Finance, stocksandnews.com, marketwatch.com, wantchinatimes.com, BBC, 361capital.com, pensionpartners.com, cnbc.com, FactSet) These are the opinions of WE Sherman and Co and not necessarily those of Cambridge, are for informational purposes only, and should not be construed or acted upon as individualized investment advice.
Securities offered through Registered Representatives of Cambridge Investment Research Inc., a broker-dealer, member FINRA/SIPC. Advisory Services offered through Cambridge Investment Research Advisors, a Registered Investment Adviser. Strategic Investment Partners and Cambridge are not affiliated.
Indices mentioned are unmanaged and cannot be invested into directly. Past performance is no guarantee of future results. All Investing involves risk. Depending on the types of investments, there may be varying degrees of risk. Investors should be prepared to bear loss, including total loss of principal.