
7-11-2022 Weekly Market Update
The very Big Picture
The long-term valuation of the market is commonly measured by the Cyclically Adjusted Price to Earnings ratio, or “CAPE”, which smooths-out shorter-term earnings swings in order to get a longer-term assessment of market valuation. A CAPE level of 30 is considered to be the upper end of the normal range, and the level at which further PE-ratio expansion comes to a halt (meaning that further increases in market prices only occur as a general response to earnings increases, instead of rising “just because”). The market is now above that level.
Of course, a “mania” could come along and drive prices higher – much higher, even – and for some years to come. Manias occur when valuation no longer seems to matter, and caution is thrown completely to the wind – as buyers rush in to buy first, and ask questions later. Two manias in the last century – the “Roaring Twenties” of the 1920s, and the “Tech Bubble” of the late 1990s – show that the sky is the limit when common sense is overcome by a blind desire to buy. But, of course, the piper must be paid, and the following decade or two were spent in Secular Bear Markets, giving most or all of the mania-gains back.
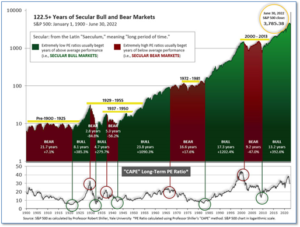
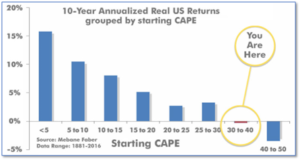
See Fig. 1 for the 100-year view of Secular Bulls and Bears. The CAPE is now at 30.13, up from the prior week’s 29.55. Since 1881, the average annual return for all ten-year periods that began with a CAPE in this range has been slightly positive to slightly negative (see Fig. 2).
Note: We do not use CAPE as an official input into our methods. However, if history is any guide – and history is typically ‘some’ kind of guide – it’s always good to simply know where we are on the historic continuum, where that may lead, and what sort of expectations one may wish to hold in order to craft an investment strategy that works in any market ‘season’ … whether the current one, or one that may be ‘coming soon’!
The Big Picture:
The ‘big picture’ is the (typically) years-long timeframe – the timeframe in which Cyclical Bulls and Bears operate. The U.S. Bull-Bear Indicator finished the week in Bear territory at 32.02, up from the prior week’s 30.63.

In the Quarterly- and Shorter-term Pictures
The Quarterly-Trend Indicator based on the combination of U.S. and International Equities trend-statuses at the start of each quarter – was Negative entering July, indicating negative prospects for equities in the third quarter of 2022.
Next, the short-term(weeks to months) Indicator for US Equities turned positive on June 24, and ended the week at 12, unchanged from the prior week.
In the Markets:
U.S. Markets: U.S. equities erased much the previous week’s losses on optimism that the Federal Reserve will be able to slow inflation without tipping the economy into recession. The gains pulled the benchmark S&P 500 index out of bear market territory, leaving it down 19.1% from its January peak. The Dow Jones Industrial Average retraced most of last week’s decline, rising 0.8% to 31,338. The technology-heavy NASDAQ Composite rallied 4.6% and finished at 11,635. By market cap, the large cap S&P 500 added 1.9% while the mid cap S&P 400 and small cap Russell 2000 gained 1.1% and 2.4%, respectively.
International Markets: Almost all major international markets finished in the green as well. Canada’s TSX rose 0.9%, while the United Kingdom’s FTSE 100 added 0.4%. On Europe’s mainland, France’s CAC 40 and Germany’s DAX rose 1.7% and 1.6%, respectively. China’s Shanghai Composite had its first down week in six, however, pulling back ‑0.9%. Japan rose 2.2%. As grouped by Morgan Stanley Capital International, developed markets gave up -0.5%, while emerging markets finished up 0.6%.
Commodities: Major commodities finished the week in the red. Precious metals sold off with Gold falling -3.3% to $1742.30 per ounce, while Silver retreated -2.2% to $19.24. Energy retraced all of last week’s rebound and then some. West Texas Intermediate crude oil declined -3.4% to $104.79 per barrel, while Brent crude declined -3.9% to $107.15. The industrial metal copper, viewed by some analysts as a barometer of world economic health due to its wide variety of uses, finished down -2.3% – its fifth consecutive weekly decline.
U.S. Economic News: Employers added 372,000 new jobs in June, well above the consensus forecast of around 250,000. The much better-than-expected reading signaled the economy is still powering ahead despite an avalanche of predictions of an impending recession. Hiring in professional employment led the way rising by 74,000, while bars, restaurants, hotels and other hospitality businesses created 67,000 new jobs. Corporate economist Robert Frick at Navy Federal Credit Union remarked, “June’s strong job growth, especially in the teeth of high inflation, shows that the expansion remains on solid ground.” However, one concern was that the size of the labor force fell for the second time in three months. The labor force tends to stagnate when hiring slows or jobs become harder to find. The unemployment remained unchanged at 3.6%.
The number of Americans filing first time unemployment claims rose to a six-month high last week, a sign the labor market may finally be slowing. The Labor Department reported 235,000 people applied for initial jobless benefits last week, an increase of 4,000 over the previous week. Economists had expected initial claims to total 230,000. Most of the increase in raw or actual jobless claims was concentrated in just a handful of states: New York, Michigan, California and Georgia. The increase in Michigan is likely tied to temporary furloughs among automakers. Meanwhile, the number of people already collecting unemployment benefits rose by 51,000 to 1.38 million. That’s the biggest one-week increase since September.
The U.S. economy by many measures appears to be cooling, but the labor market remains quite robust. The Labor Department reported job openings fell slightly in May to a still-high 11.3 million. Layoffs remained near a record low. Job openings have slipped for two months in a row after peaking in March, but they’ve topped 11 million for six consecutive months. Job openings fell the most at white-collar profession businesses (-325,000) and manufacturing (‑208,000). Technology companies in particular are scaling back. Meanwhile, the number of people who quit their jobs fell slightly to 4.27 million. The closely watched ‘quits rate’ slipped to 2.8% from 2.9%. Analysts view the quits rate as a more reliable view of the state of the economy as it is assumed that one would only quit a job in lieu of a more lucrative one. Nick Bunker, director of economic research at Indeed Hiring Lab noted, “This is not what a recession looks like”. The May job openings data “obviously lags what’s happening in the labor market presently, but all signs are that it remains strong.”
Orders for U.S. factory goods jumped 1.6% in May, bucking a string of recent data showing a softening in the economy. However, some analysts were quick to point out the increase was primarily due to petroleum-related products whose prices have risen sharply. The increase in orders exceeded the 0.6% forecast by economists. However, a survey of senior manufacturing executives signaled a slowdown in June. The Institute for Supply Management (ISM) reported its national factory activity index slipped to a two-year low as orders contracted for the first time since the start of the pandemic in the spring of 2020. Manufacturing accounts for 12% of the U.S. economy and is being held up by strong demand for goods even as overall spending rotates more toward the services sector.
In a similar survey, ISM reported its barometer of business conditions at service-oriented companies such as restaurants, hotels, and retailers, dipped to a two-year low of 55.3 in June—another sign of a slowing U.S. economy. However, the reading exceeded the consensus forecast of 54. Still, while numbers over 50 signify expansion over contraction, the index has fallen three months in a row. “Inflation is definitely taking a bite from our sales,” a retail executive told the Institute for Supply management. Furthermore, the situation doesn’t appear likely to improve anytime soon. The new orders index dropped 2 points to 55.6—a 16 month low, while the employment index fell 2.8 points to 47.4. That’s the third negative reading in employment over the past five months—and the lowest in almost two years.
Federal Reserve officials remained resolute about the need to continue their interest rate hiking trajectory according to the minutes of its June policy meeting released this week. Fed officials “recognized that policy firming could slow the pace of economic growth for a time, but they saw the return of inflation to 2% as critical to achieving maximum employment on a sustained basis,” the minutes said. Officials agreed to a rare 75 basis point hike in the Fed funds rate in June – the largest rate hike since 1994 – and “judged that an increase of 50 or 75 bp would likely be appropriate at the next meeting.” The central bankers agreed that “the labor market was very tight, inflation was well above the Committee’s 2% inflation objective and the near-term inflation outlook had deteriorated since the time of the May meeting.” In June, Fed officials penciled in getting the policy rate up to near 3.5% by the end of this year and close to 4% in 2023.
International Economic News: Economists at the Royal Bank of Canada (RBC) warned that Canada was going to enter a ‘moderate and short-lived’ recession next year as it copes with rising interest rates and rising inflation. In its latest report, the bank said Canada’s unemployment rate is now almost a full percentage point below RBC’s assumption of the longer-run, non-inflationary level. “(Recession) has become, in our view, the most likely outcome,” Nathan Janzen, one of the report’s authors, said. The report predicts the Bank of Canada will follow the lead of the U.S. Federal Reserve, which hiked rates by 75 basis points in June, during its meeting next week. RBC now expects the Bank of Canada to lift rates to 3.25% by the end of 2022, which they noted is high enough to significantly restrict growth, particularly in Canada, where household debt is very high.
Across the Atlantic, British PM Boris Johnson was forced to resign as dozens of members of his party quit the government after one ethics scandal too many. Outside of parliament, his popularity was also in shambles as surging inflation and stagnation weighs on the British economy. Every major economy has suffered from the effects of the coronavirus pandemic, but the United Kingdom has had it worse than most of its peers. Inflation hit a 40-year high of 9.1% in May—the highest among G-7 economies. Furthermore, it is forecast to climb above 11% later this year.
On Europe’s mainland, the French government has unveiled a 20 billion euro ($20.3 billion USD) package of measures meant to help struggling households cope with rising food and energy prices. The government’s move comes as annual inflation reached a record 8.6% for the 19 countries using the euro, propelled by a huge increase in food and energy costs. In France, annual inflation is estimated to be 6.5%, among the lowest in the Eurozone. The measures include increasing pensions, raising welfare payments, caps on rent increases, and pay raises for civil servants (all themselves inflationary).
Germany is no longer exporting more than what it imports from other countries, highlighting the strains that the nation and other European economies are facing from surging energy and food prices. For the first time in 30 years Germany posted its first monthly trade deficit. Germany posted a foreign trade deficit of 1 billion euros ($1.03 billion USD) in May as import prices surged. This marks a significant moment for the German economy, which had reported trade surpluses every month since 1991. “Germany’s vaunted trade surplus is gone,” Carl Weinberg, chief economist at High Frequency Economics, said in a note, adding that “higher prices for imports of energy, food and materials are goosing up the import bill.”
In Asia, the United States and China held talks this week to discuss the huge challenges facing the global economy and rising speculation that some Trump-era tariffs could be cut to ease inflation and boost growth. US Treasury Secretary Janet Yellen and China’s Vice Premier Liu He — Beijing’s top economic official — had a “substantive conversation” on a call, according to a statement by the US Treasury. The talks, which were initiated by the United States, were described as “candid” and came amid reports the Biden administration may lift some tariffs on Chinese goods as soon as this week. The Chinese readout noted that the exchange was “constructive” and “pragmatic.” It added that the two sides discussed “views on the macroeconomic situation and the stability of the global industrial chain and supply chain.” Both sides agreed that the global economy is facing severe challenges and placed “great significance” on better policy coordination between China and the United States.
Japan’s household spending posted a surprise drop in May, falling for a third consecutive month. Government data showed Japan’s spending slipped 0.5% in May from a year earlier. The consensus forecast was for a 2.1% increase. Policymakers have been worried about growing pressure on households which are facing surging prices of food and other daily essentials as well as higher costs of utilities such as electricity. Japan’s economy is projected to rebound on stronger consumption in the second quarter following contraction in January-March, however higher prices for energy and raw materials are clouding the economic outlook.
(Sources: All index- and returns-data from Yahoo Finance; news from Reuters, Barron’s, Wall St. Journal, Bloomberg.com, ft.com, guggenheimpartners.com, zerohedge.com, ritholtz.com, markit.com, financialpost.com, Eurostat,0020Statistics Canada, Yahoo! Finance, stocksandnews.com, marketwatch.com, wantchinatimes.com, BBC, 361capital.com, pensionpartners.com, cnbc.com, FactSet.) Content provided by WE Sherman and Company. Securities offered through Registered Representatives of Cambridge Investment Research Inc., a broker-dealer, member FINRA/SIPC. Advisory Services offered through Cambridge Investment Research Advisors, a Registered Investment Adviser. Strategic Investment Partners and Cambridge are not affiliated. Indices mentioned are unmanaged and cannot be invested into directly. Past performance is no guarantee of future results.