
7-4-2022 Weekly Market Update
The very Big Picture
The long-term valuation of the market is commonly measured by the Cyclically Adjusted Price to Earnings ratio, or “CAPE”, which smooths-out shorter-term earnings swings in order to get a longer-term assessment of market valuation. A CAPE level of 30 is considered to be the upper end of the normal range, and the level at which further PE-ratio expansion comes to a halt (meaning that further increases in market prices only occur as a general response to earnings increases, instead of rising “just because”). The market is now above that level.
Of course, a “mania” could come along and drive prices higher – much higher, even – and for some years to come. Manias occur when valuation no longer seems to matter, and caution is thrown completely to the wind – as buyers rush in to buy first, and ask questions later. Two manias in the last century – the “Roaring Twenties” of the 1920s, and the “Tech Bubble” of the late 1990s – show that the sky is the limit when common sense is overcome by a blind desire to buy. But, of course, the piper must be paid, and the following decade or two were spent in Secular Bear Markets, giving most or all of the mania-gains back.
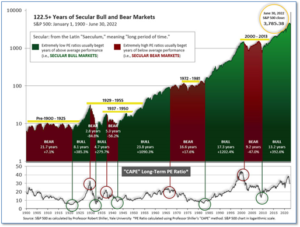
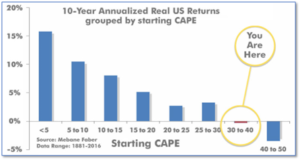
See Fig. 1 for the 100-year view of Secular Bulls and Bears. The CAPE is now at 29.55, down from the prior week’s 30.22. Since 1881, the average annual return for all ten-year periods that began with a CAPE in this range has been slightly positive to slightly negative (see Fig. 2).
Note: We do not use CAPE as an official input into our methods. However, if history is any guide – and history is typically ‘some’ kind of guide – it’s always good to simply know where we are on the historic continuum, where that may lead, and what sort of expectations one may wish to hold in order to craft an investment strategy that works in any market ‘season’ … whether the current one, or one that may be ‘coming soon’.
The Big Picture:
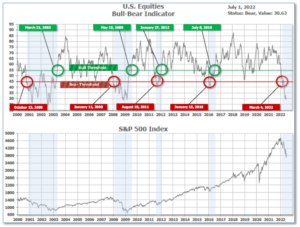
The ‘big picture’ is the (typically) years-long timeframe – the timeframe in which Cyclical Bulls and Bears operate. The U.S. Bull-Bear Indicator finished the week in Bear territory at 30.63, up from the prior week’s 30.53.
In the Quarterly- and Shorter-term Pictures
The Quarterly-Trend Indicator based on the combination of U.S. and International Equities trend-statuses at the start of each quarter – was Negative entering July, indicating negative prospects for equities in the third quarter of 2022.
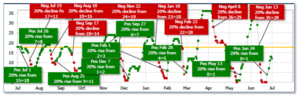
Next, the short-term(weeks to months) Indicator for US Equities turned positive on June 24, and ended the week at 12, up from the prior week’s 4.
In the Markets:
U.S. Markets: The major U.S. indexes surrendered a portion of the previous week’s strong gains, as worries grew that the Federal Reserve’s fight against inflation would push the economy into recession. The benchmark S&P 500 Index closed out its worst first half of the year since 1970. However, an afternoon rally at the end of the week lessened the blow to the downside for all the major indexes. The Dow Jones Industrial Average finished the week down -1.3% to 31,097. The technology-heavy NASDAQ Composite gave up roughly half of last week’s surge, falling -4.1%. The large cap S&P 500 and small cap Russell 2000 each finished down -2.2%, while the mid cap S&P 400 ended the week down -1.6%.
International Markets: International markets were a sea of red last week, except for China. Canada’s TSX declined ‑1.1%, while the United Kingdom’s FTSE 100 ticked down -0.6%. France and Germany each finished down ‑2.3%, while China’s Shanghai Composite finished the week up 1.1%–its fifth consecutive week of gains. Japan’s Nikkei ended down -2.1%. As grouped by Morgan Stanley Capital International, developed markets finished the week down -1.8%. Emerging markets ended down -2.0%.
Commodities: Major commodities finished the week mixed. West Texas Intermediate crude oil rebounded 0.8% to $108.42 per barrel, while precious metals declined. Gold shed -1.6% to $1801.50 per ounce, while Silver plunged -6.9% to $19.67. The industrial metal copper, viewed by some analysts as a barometer of global economic health due to its wide variety of uses, ended the week down -3.7%.
June and Q2 Summary: It was a terrible month and quarter for almost all domestic and international equity markets, with China being the lone exception. For the month of June, the Dow Jones Industrial Average shed -6.7%, the Nasdaq -8.7%, and the S&P 500 ‑8.4%; Mid caps finished the month down -9.8% and small caps declined -8.4%. In the second quarter of 2022, the Nasdaq gave up -22.4%, the Dow fell -11.3%, and the S&P 500 declined -16.4%. Mid caps and small caps ended the quarter down -15.8% and -17.5%, respectively. Almost all international markets finished the month to the downside, save one. Canada declined -9%, the UK gave up -5.8%, and France retreated -8.4%. Germany plunged ‑11.2%, while China rose 6.7%. Japan ended the month down -3.3%. Developed markets declined ‑8.8% in June, emerging markets shed -5.2%. In the second quarter, Canada was the biggest international loser giving up ‑13.8% while the United Kingdom declined -4.6%. France and Germany were off -11.1% and -11.3%, respectively. China rose 4.5%. Japan declined -5.1%. Developed markets declined -13.2% in the second quarter, emerging markets ended down -10.4%. Most major commodities also declined in both June and Q2. Gold and silver finished the month of June down -2.2% and -6.2%, respectively. Oil declined -7.8% and Copper ended the month down -13.6%. In the second quarter, Gold shed -7.5%, Silver plunged -19%, and copper collapsed -21.9% but oil rose 5.5%.
U.S. Economic News: The number of Americans filing for first-time unemployment benefits fell by 2,000 to 231,000 last week. Economists had expected claims to total 230,000. The four-week average of claims, smoothed to iron out the weekly volatility, rose by 7,250 to 231,750—the highest level since December. Meanwhile, the number of people already collecting jobless benefits, known as continuing claims, fell by 3,000 to 1.33 million. That number is now back to pre-COVID crisis levels. While still robust, many analysts don’t think the labor market can show much improvement from these levels. Nancy Vanden Houten, lead U.S. economist at Oxford Economics stated, “The level of claims is still relatively low, but we don’t expect claims to fall much below the levels of the last few weeks. While labor markets remain very tight, reports of layoffs are increasing.”
Home prices continued to rise in April, according to the latest report from S&P Case-Shiller. The Case-Shiller 20‑city home price index posted a 21.2% year-over-year gain in April, up a tick from the 21.1% reading the previous month. A separate report from the Federal Housing Finance Agency showed a 1.6% monthly gain, and that index was up 18.8% from the previous year. Tampa, Miami, and Phoenix reported the highest year-over-year gains among the 20 cities in April. By region, price growth was strongest in the South and Southeast, which saw over 30% growth. D.C., Minneapolis, and Chicago reported the lowest year-over-year gains. Selma Hepp of S&P CoreLogic noted there was a “notable deceleration of monthly gains in the Western markets.” And with mortgage rates rising, a “more challenging macroeconomic environment may not support extraordinary home price growth for much longer,” she added.
Pending home sales, which are transactions in which a contract has been signed but not yet closed, rose 0.7% in May, according to the National Association of Realtors. Analysts had been expecting a drop of 4%. The increase broke a six-month streak of declines and came even as mortgage rates continued to rise. Still, compared with the same time last year, sales were down -13.6%. Regionally, the index jumped the most in the Northeast, and fell both in the Midwest and the West. Economists look at pending home sales data as an indicator for the direction of existing-home sales in subsequent months.
Confidence among the nation’s consumers fell to a 16-month low as the high price of gas and food weighed on sentiment. The Conference Board reported consumer confidence fell to 98.7 in June, from 103.2. Economists had expected just a 3.2 point drop to 100. The U.S. economy has slowed and is likely to keep slowing with the Federal Reserve raising interest rates to try to tame the highest inflation in 40 years. In the details, how consumers feel about the economy right now dipped 0.3 point to 147.1, while a similar gauge that asks consumers how they anticipate the next six months fell more sharply to 66.4 from 73.7. Thomas Simons, money market economist at Jefferies LLC stated, “It looks like this is another piece of evidence showing concerns about a recession are rising among consumers.”
A key gauge of inflation rose sharply in May, largely due to the higher cost of gas and food, but there were signs that price pressures may be starting to ease. The ‘personal consumption expenditures index’, or ‘PCE-I’, rose 0.6% in May—triple its reading from April. But a narrower measure of inflation that omits volatile food and energy costs, known as the core PCE, rose by relatively modest 0.3% for the fourth month in a row. That was below Wall Street’s 0.4% forecast. The rate of inflation over the past year remained unchanged at 6.3% in April. The yearly rate has backed off a little after touching a 40-year high a few months ago. The core rate of inflation also slowed to 4.7% in the 12 months ended in May from 4.9% in April. Analysts note that the Federal Reserve views the PCE index as the better barometer of inflation over the more popular Consumer Price Index (CPI).
The economy shrank at a -1.6% annual pace in the first quarter, and according to the Atlanta Fed’s GDPNow tracker, the second quarter isn’t looking much better. The contraction in gross domestic product, the official scorecard for the economy, was the first since the deep recession caused by the pandemic lockdowns in 2020. As for the second quarter, the latest estimate of the GDPNow model shows a further -1.0% contraction in the economy. Regardless of where second-quarter GDP clocks in, analysts note the economy is likely to continue to slow. The Federal Reserve remains on a hiking cycle to try and reign in the highest inflation in over 40 years. The biggest negative in the updated GDP report was a downward revision in consumer spending, the chief engine of the economy. That doesn’t bode well for the future.
Orders for goods expected to last three years or more, so-called ‘durable goods’, rose last month with a stronger-than-expected reading. The Census Department reported durable goods orders rose 0.7% in May, its seventh gain in eight months. Economists had expected just a 0.2% increase. The reading showed manufacturers still had plenty of demand for their products, even amid signs the economy was slowing. Core orders, which strip out the often-volatile transportation sector and military equipment, rose 0.5%. Orders for new cars and trucks rose 0.5%, while orders for commercial airplanes declined -1.1%. Chief economist Stephen Stanley of Amherst Pierpont Securities stated, “From everything I have seen, business investment remains strong, though it certainly would not be surprising to see some moderation going forward as borrowing rates and uncertainty regarding the economic outlook rise.”
International Economic News: A preliminary estimate of Canada’s economy showed it most likely contracted in May, largely due to a drop in oil and gas output. Statistics Canada said gross domestic product likely declined -0.2% in May, following a gain of 0.3% in April. “In the near-term we won’t know whether the economy is making a U-turn or just a brief detour,” Royce Mendes, head of macro strategy at Desjardins Group, said in a note. Mendes added that either way, a slowdown in growth won’t alter the Bank of Canada’s plans to hike rates aggressively. The central bank is widely expected to go ahead with a fairly aggressive 75-basis point increase at its July decision.
Across the Atlantic, the Governor of the Bank of England warned Britons should expect to suffer a more severe bout of inflation than other major economies. Speaking at a conference of central bankers, Andrew Bailey said inflation was higher in the UK and would persist for longer than previously expected as soaring energy prices sent household expenses to new highs. “I think the UK economy is probably weakening rather earlier and somewhat more than others,” he said. Bailey said he was determined to bring down inflation and was prepared to use the Bank’s power to increase interest rates aggressively in response.
On Europe’s mainland, as the war in Ukraine enters its fourth month, French President Emmanuel Macron said France and Europe need to prepare for a “wartime economy” in order to deal with the geopolitical and economic effects that continue to ripple across the continent. The French president called the times “unprecedented” and said it is necessary for not only states but all economic agents to move faster, at a lower cost, and innovate more rapidly to address the new challenges. Macron added that there can be no “national security, strategic autonomy, and therefore no peace” if those actors don’t adapt to the current geopolitical conditions.
A sharp drop in new orders weighed on German manufacturing activity in June, a survey showed. S&P Global’s Purchasing Managers’ Index (PMI) for manufacturing fell to 52.0 in June, down 2.8 points from May’s reading. The reading was in line with the consensus forecast. However, it was a sharp drop in new orders that raised concerns. The index of new orders came in at 43.3, down 3.7 points from May and hitting its lowest level since May 2020. Phil Smith, economics associate director at S&P Global Market Intelligence stated, “We’re seeing a rapid correction in underlying demand for German goods” and added firms reported “multiple headwinds to export sales”.
In Asia, China’s factory activity snapped a three-month losing streak and its services sector continued to rebound. China’s National Bureau of Statistics reported its official manufacturing PMI rose to 50.2 in June from 49.6 in May. Analysts attribute the rebound to authorities lifting their strict “zero-COVID” policy lockdowns in Shanghai. Meanwhile, the official non-manufacturing (services) PMI in June improved to 54.7 from 47.8 in May. China’s official composite PMI, which includes both manufacturing and services activity, stood at 54.1, compared with 48.4 in May.
The Bank of Japan will maintain its ultra-loose monetary policy, despite Japan’s core consumer inflation hitting 2.1% for two consecutive months. Kuroda stated the increase was due almost entirely to soaring energy prices. “Unlike other economies, the Japanese economy has not been much affected by the global inflationary trend, so monetary policy will continue to be accommodative,” Kuroda said, according to the recording released by the Bank for International Settlements (BIS). Kuroda noted Japan’s long experience with deflation have made the country’s companies “very cautious” in raising prices and wages. Soaring global commodity prices and a weak yen, which inflates the cost of importing raw material, have pushed Japan’s core consumer inflation above the BOJ’s 2% target.
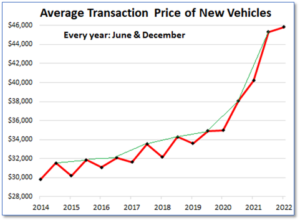
Finally: It’s not just housing—the average transaction price of new vehicles sold in June hit a new stratospheric record high of $45,844, up 14% from a year ago. As automakers continue to struggle with shortages of key parts and semiconductors in particular, inventories remain near historic lows. Dealers handled the shortages by charging more than list price and filling their lots with only the most expensive vehicles loaded with as many options as possible—and that’s how the ATP (average transaction price) jumped to a new record. Since June 2019, the ATP has spiked by 36%, or by over ten grand per vehicle! (Chart by wolfstreet.com, data by JD Power)
(Sources: All index- and returns-data from Yahoo Finance; news from Reuters, Barron’s, Wall St. Journal, Bloomberg.com, ft.com, guggenheimpartners.com, zerohedge.com, ritholtz.com, markit.com, financialpost.com, Eurostat,0020Statistics Canada, Yahoo! Finance, stocksandnews.com, marketwatch.com, wantchinatimes.com, BBC, 361capital.com, pensionpartners.com, cnbc.com, FactSet.) Content provided by WE Sherman and Company. Securities offered through Registered Representatives of Cambridge Investment Research Inc., a broker-dealer, member FINRA/SIPC. Advisory Services offered through Cambridge Investment Research Advisors, a Registered Investment Adviser. Strategic Investment Partners and Cambridge are not affiliated. Indices mentioned are unmanaged and cannot be invested into directly. Past performance is no guarantee of future results.