
6-5-2023 Weekly Market Update
The very Big Picture
The long-term valuation of the market is commonly measured by the Cyclically Adjusted Price to Earnings ratio, or “CAPE”, which smooths-out shorter-term earnings swings in order to get a longer-term assessment of market valuation. A CAPE level of 30 is considered to be the upper end of the normal range, and the level at which further PE-ratio expansion comes to a halt (meaning that further increases in market prices only occur as a general response to earnings increases, instead of rising “just because”). The market was recently above that level, and has fallen back.
Of course, a “mania” could come along and drive prices higher – much higher, even – and for some years to come. Manias occur when valuation no longer seems to matter, and caution is thrown completely to the wind – as buyers rush in to buy first, and ask questions later. Two manias in the last century – the “Roaring Twenties” of the 1920s, and the “Tech Bubble” of the late 1990s – show that the sky is the limit when common sense is overcome by a blind desire to buy. But, of course, the piper must be paid, and the following decade or two were spent in Secular Bear Markets, giving most or all of the mania-gains back.
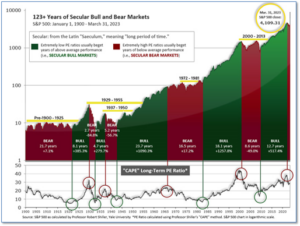
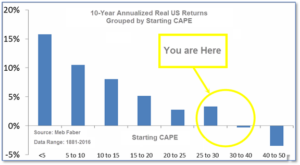
See Fig. 1 for the 100-year view of Secular Bulls and Bears. The CAPE is now at 29.97, up from the prior week’s 29.48. Since 1881, the average annual return for all ten-year periods that began with a CAPE in this range has been slightly positive to slightly negative (see Fig. 2).
Note: We do not use CAPE as an official input into our methods. However, if history is any guide – and history is typically ‘some’ kind of guide – it’s always good to simply know where we are on the historic continuum, where that may lead, and what sort of expectations one may wish to hold in order to craft an investment strategy that works in any market ‘season’ … whether the current one, or one that may be ‘coming soon’!
The Big Picture:
The ‘big picture’ is the (typically) years-long timeframe – the timeframe in which Cyclical Bulls and Bears operate. The U.S. Bull-Bear Indicator finished the week in Bull territory at 61.24, up from the prior week’s 58.60.(see Fig. 3)

In the Quarterly- and Shorter-term Pictures
The Quarterly-Trend Indicator based on the combination of U.S. and International Equities trend-statuses at the start of each quarter – was Positive entering April, indicating positive prospects for equities in the second quarter.
Next, the short-term(weeks to months) Indicator for US Equities turned positive on May 25, and ended the week at 13, up from the prior week’ 12.

In the Markets:
U.S. Markets: The major benchmarks ended the week with solid gains, with the S&P 500 index touching its highest intraday level since mid-August of 2022. The technology-heavy NASDAQ Composite notched its sixth consecutive weekly gain and hit its best level since mid-April 2022. In contrast with the last several weeks, the rally was broad-based with strong gains across value and growth stock as well as small-cap companies. The Dow Jones Industrial Average added 2% in the holiday-shortened week closing at 33,763. The NASDAQ closed up 2% as well to 13,241. By market cap, the large cap S&P 500 added 1.8%, while the mid cap S&P 400 rose 2.6%. The small cap Russell 2000 rebounded 3.3%. For the month of May, the NASDAQ surged 5.8% followed by the S&P 500 which added 0.2%. The Dow ended the month down -3.5%, midcaps down -3.4%, and small caps down -1.1%.
International Markets: Major international markets finished the week mixed. Canada’s TSX rose 0.5%, while the UK’s FTSE 100 declined -0.3%. France’s CAC 40 ended down -0.7%, while Germany’s DAX added 0.4%. In Asia, China’s Shanghai Composite rose 0.5% and Japan’s Nikkei added 2%. As grouped by Morgan Stanley Capital International, developed markets rose 0.7% while emerging markets added 1.4%. May was a difficult month for all the major international indexes except Japan. Canada and the UK fell -5.2% and -5.4%, while France pulled back -5.2%. Germany ended the month down -1.6%. China retreated -3.6%, but Japan rallied 7%–its fifth consecutive month of gains. Developed markets pulled back -4%, while emerging markets ended the month down -2.4%.
Commodities: Commodities finished the week predominantly to the upside as well. Gold rose 1.3% to $1969.60 per ounce, while Silver added 1.7% to $23.75 per ounce. The industrial metal copper, viewed by some analysts as a barometer of world economic health due to its wide variety of uses, finished the week up 1.2%. West Texas Intermediate crude oil pulled back -1.3% to $71.74 per barrel. For the month of May, Gold pulled back -0.9%, while Silver declined -6.5%. Copper ended the month down -6.5% as well, while crude oil gave up -11.3% last month.
U.S. Economic News: The number of Americans filing new claims for unemployment benefits increased modestly last week, pointing to continued tightness in the labor market. Initial claims for state unemployment benefits rose by just 2,000 to a seasonally adjusted 232,000 for the week ended May 27, the Labor Department said. Economists had forecast 235,000 claims for the latest week. There have been high-profile layoffs in the technology sector and industries sensitive to interest rates, such as housing, but employers have been generally hoarding workers after difficulties finding labor in the wake of the COVID-19 pandemic. Meanwhile, continuing claims, which count the number of people already receiving benefits increased by 6,000 to 1.795 million.
Job growth accelerated in May with nonfarm payrolls rising by 339,000 jobs last month. However, a surge in the unemployment rate to a seven-month high of 3.7% suggested labor market conditions were easing. That could give the Federal Reserve the impetus to skip an interest rate hike later this month. The increase in the unemployment rate from a 53-year low of 3.4% in April was the largest since late spring of 2020. Outside the COVID-19 pandemic, it was the biggest jump since 2010, reflecting a drop in household employment and a rise in the workforce. Additionally, wage growth moderated last month, which should offer some comfort to Fed officials battling to bring inflation back to the U.S. central bank’s 2% target. Sal Guatieri, a senior economist at BMO Capital Markets noted, “There’s likely enough pockets of softness in this report for the Fed to pass on raising rates at the next meeting.”
The number of job openings unexpectedly rose in April pointing to persistent strength in the labor market. The Job Openings and Labor Turnover Survey, or JOLTS report, showed job openings, a measure of labor demand, increased by 358,000 to 10.1 million. Furthermore, layoffs declined significantly last month. There were 1.8 job openings for every unemployed person in April, up from 1.7 in March, and well above the 1.0-1.2 range that is considered consistent with a jobs market that is not generating too much inflation. Priscilla Thiagamoorthy, a senior economist at BMO Capital Markets stated, “This is not what the Fed was hoping to see.” Fed Chair Jerome Powell has been hoping to see the job market cool, relieving pressure on companies to raise wages and prices. Trimming job openings now is relatively painless compared to laying off workers in the future. The latest report is a setback for that scenario.
Steep competition in the housing market and low supply are heating up home prices, according to the latest reading of the S&P CoreLogic Case-Shiller home price index. Across the country, home prices were up 0.7% from the same time last year. Craig J. Lazzara, managing director at S&P DJI said in the release, “The modest increases in home prices we saw a month ago accelerated in March 2023. Two months of increasing prices do not a definitive recovery make, but March’s results suggest that the decline in home prices that began in June 2022 may have come to an end.” On a monthly basis, home prices increased 0.4% nationally in March compared with February, while the more narrowly-focused 20-city composite rose 0.5%. Miami, Tampa, Florida, and Charlotte, North Carolina, saw the highest year-over-year gains among the 20 cities in March. Seattle (-12.4%) and San Francisco (-11.2%) reported the biggest declines.
Confidence among the nation’s consumers fell to a six-month low as Americans’ views of the labor market weakened. The Conference Board reported its U.S. consumer confidence index slipped to 102.3 this month—the lowest level since November. Economists had expected the index to fall to 99. Consumers were less optimistic on the labor market, with the share viewing jobs as “plentiful” falling to the lowest level since April 2021 and the proportion of those saying jobs were “hard to get” rising to a six-month high. Notably, the share of consumers planning to buy a new vehicle or other big-ticket items over the next six months increased compared to April. That suggests consumer spending could support growth this quarter after it accelerated at its fastest pace in nearly two years in the first quarter.
U.S. economic activity appears to have stalled in recent weeks according to the Federal Reserve’s latest ‘Beige Book’, a collection of anecdotal reports from each of its member banks. “Expectations for future growth deteriorated a little, though contacts still largely expected a further expansion in activity,” the U.S. central bank said. Contacts across districts noted that while labor markets remained strong, they had “cooled some,” the report said, with businesses in some regions reporting a pause in hiring or reductions in staffing due to weaker demand or greater uncertainty. Meanwhile, districts reported that the pace of inflation had slowed, with prices rising “moderately” and contacts in most parts of the country expecting a similar pace of price increases in the coming months. About half of districts reported no change in economic activity in recent weeks, the report showed, while four reported small increases and two reported “slight to moderate declines.”
International Economic News: Stronger-than-expected economic growth in the first quarter could force the Bank of Canada to end its pause and hike interest rates again during one of its meetings over the summer. Gross domestic product, the country’s main gauge on the amount of goods and services changing hands, expanded at a 3.1% annualized pace over the first three months of the year. Economists had expected growth of only 2.5% and the Bank of Canada had forecast 2.3%. Markets are now pricing in a 40% chance of a hike next week, up from 28% before the data. They now expect an increase of 25 basis points by September. “It seems likely the Bank of Canada will be seriously considering raising rates next week,” said Royce Mendes, Desjardins head of macro strategy, in a recent note. “While they might pass on changing course just yet, the belief that the central bank will further tighten policy this summer is justifiably gaining traction.”
The British Retail Consortium reported prices in UK stores are rising at a record pace. The cost of store items, known as shop price inflation, rose 9% through the year to May, a fresh high for an index that dates back to 2005. Food inflation dipped slightly to 15.4% in May, but that’s still the second-highest rate on record. The slight drop in food prices will give cold comfort to consumers, and puts pressure on Prime Minister Rishi Sunak, who has promised to halve inflation this year as one of his five pledges to voters. Food prices have contributed to keeping inflation “higher than we expected it to be,” Bank of England Governor Andrew Bailey told a Treasury committee hearing last week. “We have a lot to learn about operating monetary policy in a world of big shocks,” he admitted.
The French government is working hard to prove to credit rating agency S&P Global that it should not downgrade the country’s rating despite high debt and deficit levels. Economy Minister Bruno Le Maire said, “We have good arguments to put forth.” The current ‘AA-’ grade is likely to get downgraded, with debt levels one of the highest in the EU at 111.6% of GDP in 2022, and a yearly deficit of just below 5% of GDP. Another credit rating agency, Fitch, downgraded France’s rating from ‘AA’ to ‘AA-’ in late April, citing unsatisfying debt reduction plans and social unrest. “We have a credible strategy to accelerate France’s debt reduction path,” Le Maire said, who committed to reducing debt levels to 108.3% by 2027. The country is also passed the worst part of the inflationary crisis, French Central Bank head François Villeroy de Galhau stated.
Germany joined a list of major euro zone economies reporting a bigger than expected drop in inflation, suggesting that price growth may be falling more quickly than expected and adding to arguments for caution on rate hikes. The European Central Bank has raised rates by a record 375 basis points in the past year and already flagged another move in June. But policy “doves,” particularly from the euro zone’s southern rim, have called for a more tempered approach as the increases are still working their way through the economy. In Germany, inflation eased this month to its lowest level in more than a year, official data showed. Consumer prices in harmonized terms fell 0.2% on the month.
China’s factory activity plummeted in May as demand weakened, adding pressure on policymakers to shore up a fragmented economic recovery. The National Bureau of Statistics reported that chemical, ferrous metal smelting and rolling processing industries faced significant declines in production and demand. The official manufacturing purchasing managers’ index (PMI) dropped to a five-month low of 48.8, which was down from 49.2 earlier this quarter. The PMI index remains below the 50-point mark that separates expansion from contraction. Economists had expected an increase to 49.4. China’s economic recovery following three years of lockdowns has been tense with services spending outperforming activity in the factory, property, and export-oriented sectors. Bruce Pang, chief economist at Jones Lang LaSalle noted, “sluggish domestic demand could weigh on China’s sustainable growth, if there are no efficient and effective policy moves to engineer a broad-based recovery.”
Bank of Japan Governor Kazuo Ueda said the central bank intends to maintain its ulta-loose monetary policy as the BOJ’s 2% inflation target remains some distance away. Ueda told parliament that he expects “inflation to quite clearly slow below 2 per cent” towards the middle of the current fiscal year. The BOJ is expecting significant pay increases for this year’s annual wage negotiations, which could amend Japan’s deflationary outlook. Meanwhile, the BOJ’s new governor will continue to phase out his predecessor’s stimulus in response to the accumulating side effects of prolonged easing, such as distortions in market pricing caused by its extensive bond buying. Ueda said the BOJ would continue its long-term government bond buying operations for the time being. He added, “(We) will patiently continue monetary easing as there’s still distance to achievement of sustainable and stable 2 per cent price hikes together with continued rises in wages.”
Finally: This year the U.S. plans to build more than 80% of its new energy installations from renewable sources like battery, solar, and wind. Nearly every state in the U.S. has plans to produce new clean energy in 2023, with the two most populous states leading the pack. While California shouldn’t surprise anyone, what’s notable is Texas currently leads the nation in planned renewable energy installations even though the majority of its power comes from natural gas. Ohio, Nevada, and Colorado round out the top five states with the highest new solar energy generation capacities in the nation. The following graphic from VisualCapitalist.com demonstrates each states’ commitment to renewable energy.

(Sources: All index- and returns-data from Norgate Data and Commodity Systems Incorporated; news from Reuters, Barron’s, Wall St. Journal, Bloomberg.com, ft.com, guggenheimpartners.com, zerohedge.com, ritholtz.com, markit.com, financialpost.com, Eurostat, Statistics Canada, Yahoo! Finance, stocksandnews.com, marketwatch.com, wantchinatimes.com, BBC, 361capital.com, pensionpartners.com, cnbc.com, FactSet.) Content provided by WE Sherman and Company. Securities offered through Registered Representatives of Cambridge Investment Research Inc., a broker-dealer, member FINRA/SIPC. Advisory Services offered through Cambridge Investment Research Advisors, a Registered Investment Adviser. Strategic Investment Partners and Cambridge are not affiliated. Indices mentioned are unmanaged and cannot be invested into directly. Past performance is no guarantee of future results. These opinions of Strategic Investment Partners and not necessarily those of Cambridge Investment Research, are for informational purposes only and should not be construed or acted upon as individualized investment advice.