
6-12-2023 Weekly Market Update
The Very Big Picture
The long-term valuation of the market is commonly measured by the Cyclically Adjusted Price to Earnings ratio, or “CAPE”, which smooths-out shorter-term earnings swings in order to get a longer-term assessment of market valuation. A CAPE level of 30 is considered to be the upper end of the normal range, and the level at which further PE-ratio expansion comes to a halt (meaning that further increases in market prices only occur as a general response to earnings increases, instead of rising “just because”). The market was recently above that level, and has fallen back.
Of course, a “mania” could come along and drive prices higher – much higher, even – and for some years to come. Manias occur when valuation no longer seems to matter, and caution is thrown completely to the wind – as buyers rush in to buy first, and ask questions later. Two manias in the last century – the “Roaring Twenties” of the 1920s, and the “Tech Bubble” of the late 1990s – show that the sky is the limit when common sense is overcome by a blind desire to buy. But, of course, the piper must be paid, and the following decade or two were spent in Secular Bear Markets, giving most or all of the mania-gains back.
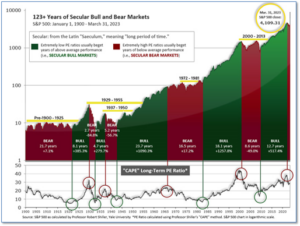
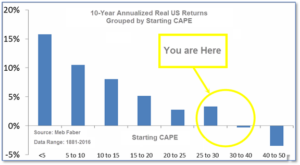
See Fig. 1 for the 100-year view of Secular Bulls and Bears. The CAPE is now at 30.09, up from the prior week’s 29.97. Since 1881, the average annual return for all ten-year periods that began with a CAPE in this range has been slightly positive to slightly negative (see Fig. 2).
Note: We do not use CAPE as an official input into our methods. However, if history is any guide – and history is typically ‘some’ kind of guide – it’s always good to simply know where we are on the historic continuum, where that may lead, and what sort of expectations one may wish to hold in order to craft an investment strategy that works in any market ‘season’ … whether the current one, or one that may be ‘coming soon’!
The Big Picture:
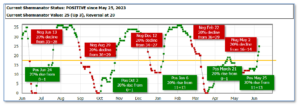
The ‘big picture’ is the (typically) years-long timeframe – the timeframe in which Cyclical Bulls and Bears operate. The U.S. Bull-Bear Indicator finished the week in Bull territory at 63.83, up from the prior week’s 61.24. (see Fig. 3)

In the Quarterly- and Shorter-term Pictures
The Quarterly-Trend Indicator based on the combination of U.S. and International Equities trend-statuses at the start of each quarter – was Positive entering April, indicating positive prospects for equities in the second quarter.
Next, the short-term(weeks to months) Indicator for US Equities turned positive on May 25, and ended the week at 25, up 12 from the prior week’s 12.
In the Markets:
U.S. Markets: Stocks closed modestly higher in a week of subdued trading ahead of the Federal Reserve’s policy meeting and rate announcement on Wednesday this week. Notably, the benchmark S&P 500 officially entered a bull market, up more than 20% from its mid-October lows. The Dow Jones Industrial Average added 114 points, closing at 33,877, a gain of 0.3%. The technology-heavy NASDAQ Composite ticked up 0.1% to 13,259—its seventh consecutive week of gains. By market cap, the large cap S&P 500 rose 0.4%, while the mid cap S&P 400 tacked on 1.5%. The small cap Russell 2000 led with adding 1.9%.
International Markets: Major international markets finished the week mixed. Canada’s TSX pulled back -0.7% along with the UK’s FTSE 100 which declined -0.6%. France and Germany also finished down declining -0.8% and -0.6% respectively. In Asia, China’s Shanghai Composite ended flat, while Japan’s Nikkei gained 2.4%–its ninth consecutive week of gains. As grouped by Morgan Stanley Capital International, developed markets added 0.2%, while emerging markets gained 1.6%.
Commodities: Commodities finished the week predominantly to the upside as well. Gold rose 0.4% to $1977.20 per ounce, while Silver gained 2.8% to $24.41. The industrial metal copper, viewed by some analysts as a barometer for world economic health due to its wide variety of uses, rose 1.7%. West Texas Intermediate crude oil pulled back -2.2% finishing the week at $70.17 per barrel.
U.S. Economic News: The number of Americans filing claims for first-time unemployment benefits jumped to a two-year high of 261,000 last week, according to the Labor Department. New jobless claims climbed by 28,000 from the prior week, with most of the increase due to two states, Ohio and California. Of the 53 U.S. states and territories that report jobless claims, 27 showed an increase last week, while the other 26 posted a decline. Meanwhile, the number of people already collecting unemployment benefits fell by 37,000 to 1.76 million.
Most U.S. businesses in the services sector grew at a slower pace in May according to the Institute for Supply Management. ISM reported its services index fell to a 5-month low of 50.3 last month–economists had expected a reading of 51.8. Most Americans work in the services side of the economy. In the details of the report, the production gauge dipped 0.5 points to 51.5—its lowest level since the start of the pandemic in early 2020, while new orders declined 3.2 points to 52.9. Notably, the employment barometer slipped 1.6 points to 49.2 and turned negative for the first time this year. Bill Adams, chief economist at Comerica wrote, “The ISM PMI surveys, and especially their prices paid components, make it more likely that the Federal Reserve chooses to hold interest rates steady at their next decision June 14, and reduces the likelihood that they make additional interest rate hikes later this year.”
Total consumer credit rose $23 billion in April, up from a revised $22.8 billion gain in the prior month, the Federal Reserve reported. That translates into a 5.71% annual rate, up from a 5.69% gain in the prior month–the fastest pace of credit growth since November. Economists had been expecting a $21.6 billion gain. Revolving credit, such as credit cards, rose 13.2% in April, slightly less than the 14.6% gain in the prior month. Nonrevolving credit, typically car and student loans, rose 3.2%, up from a 2.7% growth rate in the prior month. This category of credit is much less volatile. The Fed’s data does not include mortgage lending, which is the largest category of household debt. Consumer spending remained strong in April, easing concerns about an imminent recession. Rubella Farooqi, chief U.S. economist at High Frequency Economics wrote in a note, “We are watching these data for signs of strains on household balance sheets. But, for now, a strong labor market is still supporting incomes and consumption.”
International Economic News: The Bank of Canada hiked its overnight interest rate to a 22-year high of 4.75% this week and analysts were quick to forecast yet another increase next month to ratchet down stubbornly high inflation. The central bank had been on hold since January to assess the impact of previous hikes after raising borrowing costs eight times since March 2022 to a 15-year high of 4.50% – the fastest tightening cycle in the bank’s history. Surprisingly strong consumer spending, a rebound in demand for services, a pick-up in housing activity and a tight labor market show excess demand is more persistent than anticipated, the central bank said in its statement. “We expect another 25 basis points coming in July,” said Derek Holt, vice president of capital markets economics at Scotiabank. “It is like a bag of chips, you open one and just can’t have one,” he added.
The United Kingdom will have the highest level of inflation among all advanced economies this year, according to data from the Organization for Economic Cooperation and Development. The U.K. is set to report a headline inflation of 6.9% this year, above the OECD average of 6.6% for 2023. Among the countries analyzed in the latest OECD economic outlook, only Argentina and Turkey are expected to have a higher headline rate than the U.K. this year. The U.K. headline inflation is “projected to slow on the back of declining energy prices and to come down close to target by the end of 2024,” the OECD noted. Governor Andrew Bailey last month said that the bank’s forecasting model was not working well and that rate setters were therefore using it less. Governor Bailey also spoke of “very big lessons to learn,” after the central bank repeatedly failed to predict several increases in inflation.
France managed to avoid a fresh credit downgrade from a leading rating agency this week, despite mounting concern over the country’s surging national debt. Leading ratings agency Fitch in April lowered its rating on France’s debt, which is approaching three trillion euros ($3.2 trillion). It pointed to the country’s hung parliament and public protests as risks to plans by President Emmanuel Macron to cut government spending. Influential rival S&P Global maintained its “AA” rating dispelling fears France could face another downgrade over its chronic overspending that hasn’t seen a government budget surplus since the 1970s. The agency said the decision to maintain the rating level was “mainly due the government’s revised budgetary consolidation strategy”, as well as recently implemented labor market and pension reforms.
The German economy fell into recession in early 2023 after household spending, a key source of growth in Europe’s economic engine, succumbed to pressures from high inflation, an estimate from Destatis, Germany’s statistics office showed last month. German industry had a strong first quarter benefiting from the easing of supply chain constraints and a backlog in orders, but incoming orders have recently declined limiting companies to maintaining their activities rather than expanding them. Economic analysis company Sentix said its most recent monthly survey on investor views for Germany fell to its lowest level since November of last year at -21.1 from -14.5 the prior month.
China’s exports fell 7.5% from a year earlier in May and imports were down 4.5%, adding to signs the economic rebound following the end of anti-virus controls is slowing as global demand weakens. Exports slid to $283.5 billion, reversing from April’s unexpectedly strong 8.5% growth, customs data showed. Imports fell to $217.7 billion, moderating from the previous month’s 7.9% contraction. China’s global trade surplus narrowed by 16.1% to $65.8 billion. Trade weakness added to downward pressure on the world’s second-largest economy following lackluster factory and consumer activity and a surge in unemployment among young people. Exports to the United States tumbled 18.2% from a year earlier to $42.5 billion. “China’s exports will remain subdued, as we anticipate the U.S. economy to enter recession,” Lloyd Chan of Oxford Economics said in a report.
Japan’s economy grew an annualized 2.7% in the first quarter of the year, expanding further than earlier estimates of 1.6% made last month, government data showed. Private non-residential investment, or capital spending, rose 1.4% — higher than initial government estimates of 0.9%. Private demand rose by 1.2% and domestic demand rose by 1%, while exports of goods and services dropped 4.2%. Imports also fell 2.3%, revised government data showed. The upside surprise for Japan’s economic growth comes as Japan’s equity markets notched new three-decade highs thanks to a weak yen and plans for structural reforms.
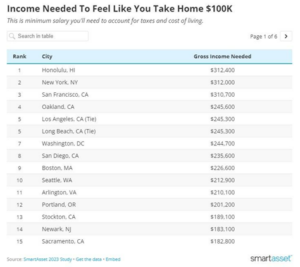
Finally: Who needs inflation if you live in one of the following cities. A new study by SmartAsset reveals that in several U.S. cities earning as much as $300,000 per year only feels like $100,000 due to the cost of living. The study adjusted $100,000 for the local cost of living in 76 of the largest cities in the U.S. using data from the Council for Community and Economic Research. The index took into account the price of housing, groceries, utilities, transportation, and other necessary purchases using recent data. The study found that three major U.S. cities required take home pay of over $300,000 to be able to spend like you earn $100,000 per year. Residents of Honolulu, New York City and San Francisco who earn this amount are taxed roughly 40.5% or higher and have a cost of living more than 82% above the national average.
(Sources: All index- and returns-data from Norgate Data and Commodity Systems Incorporated; news from Reuters, Barron’s, Wall St. Journal, Bloomberg.com, ft.com, guggenheimpartners.com, zerohedge.com, ritholtz.com, markit.com, financialpost.com, Eurostat, Statistics Canada, Yahoo! Finance, stocksandnews.com, marketwatch.com, wantchinatimes.com, BBC, 361capital.com, pensionpartners.com, cnbc.com, FactSet.) Content provided by WE Sherman and Company. Securities offered through Registered Representatives of Cambridge Investment Research Inc., a broker-dealer, member FINRA/SIPC. Advisory Services offered through Cambridge Investment Research Advisors, a Registered Investment Adviser. Strategic Investment Partners and Cambridge are not affiliated. Indices mentioned are unmanaged and cannot be invested into directly. Past performance is no guarantee of future results. These opinions of Strategic Investment Partners and not necessarily those of Cambridge Investment Research, are for informational purposes only and should not be construed or acted upon as individualized investment advice.