
5-29-2023 Weekly Market Update
The very Big Picture
The long-term valuation of the market is commonly measured by the Cyclically Adjusted Price to Earnings ratio, or “CAPE”, which smooths-out shorter-term earnings swings in order to get a longer-term assessment of market valuation. A CAPE level of 30 is considered to be the upper end of the normal range, and the level at which further PE-ratio expansion comes to a halt (meaning that further increases in market prices only occur as a general response to earnings increases, instead of rising “just because”). The market was recently above that level, and has fallen back.
Of course, a “mania” could come along and drive prices higher – much higher, even – and for some years to come. Manias occur when valuation no longer seems to matter, and caution is thrown completely to the wind – as buyers rush in to buy first, and ask questions later. Two manias in the last century – the “Roaring Twenties” of the 1920s, and the “Tech Bubble” of the late 1990s – show that the sky is the limit when common sense is overcome by a blind desire to buy. But, of course, the piper must be paid, and the following decade or two were spent in Secular Bear Markets, giving most or all of the mania-gains back.
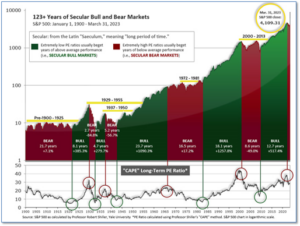
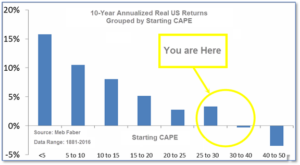
See Fig. 1 for the 100-year view of Secular Bulls and Bears. The CAPE is now at 29.48, up from the prior week’s 29.38. Since 1881, the average annual return for all ten-year periods that began with a CAPE in this range has been slightly positive to slightly negative (see Fig. 2).
Note: We do not use CAPE as an official input into our methods. However, if history is any guide – and history is typically ‘some’ kind of guide – it’s always good to simply know where we are on the historic continuum, where that may lead, and what sort of expectations one may wish to hold in order to craft an investment strategy that works in any market ‘season’ … whether the current one, or one that may be ‘coming soon’!
The Big Picture:
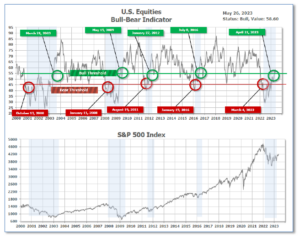
The ‘big picture’ is the (typically) years-long timeframe – the timeframe in which Cyclical Bulls and Bears operate. The U.S. Bull-Bear Indicator finished the week in Bear territory at 58.60, up from the prior week’s 56.64.(see Fig. 3)
In the Quarterly- and Shorter-term Pictures
The Quarterly-Trend Indicator based on the combination of U.S. and International Equities trend-statuses at the start of each quarter – was Positive entering April, indicating positive prospects for equities in the second quarter.
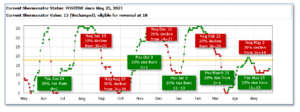
Next, the short-term(weeks to months) Indicator for US Equities turned positive on May 25, and ended the week at 13, up from the prior week’ 12.
In the Markets:
U.S. Markets: The major benchmarks ended the week mixed as investors watched carefully for signs of progress in negotiations over raising the federal debt ceiling. The technology-heavy NASDAQ Composite led the way with a fifth consecutive week of gains, rising 2.5% to 12,976. The narrowly-focused Dow Jones Industrial Average pulled back -1% to 33,093. By market cap, the large cap S&P 500 ticked up 0.3%, while the mid cap S&P 400 declined -0.5%. The small cap Russell 2000 ended the week unchanged.
International Markets: Most of the major international stock indexes finished the week in the red. Canada’s TSX retreated -2.1%, while the United Kingdom’s FTSE 100 pulled back -1.7%. France’s CAC and Germany’s DAX fell -2.3% and -1.8% respectively. In Asia, China’s Shanghai Composite declined -2.2%. Japan’s Nikkei rose for a seventh consecutive week adding 0.4%. As grouped by Morgan Stanley Capital International, developed markets pulled back -2.1%. Emerging markets ticked up 0.1%.
Commodities: Precious metals finished the week to the downside. Gold pulled back -1.9% to $1944.30 per ounce, while Silver ended down -2.9% to $23.36. The industrial metal copper, viewed by some analysts as a barometer of world economic health due to its wide variety of uses, declined -1.3%. West Texas Intermediate crude oil rebounded for a second week rising 1.4% to $72.67 per barrel.
U.S. Economic News: The number of Americans filing new claims for unemployment benefits rose moderately last week and the prior week’s data was revised lower, suggesting the labor market remains robust. Initial claims for state unemployment benefits increased by 4,000 to 229,000 last week. The reading was far below the consensus forecast of 245,000 new claims. Though claims surged recently, boosted by fraudulent applications in Massachusetts, they remain at levels consistent with a still-tight labor market. Meanwhile, continuing claims, which counts the number of people already receiving jobless benefits fell by 5,000 to 1.79 million.
Sales of new U.S. single-family homes jumped to a 13-month high in April, boosted by a persistent shortage of previously owned houses on the market and a sharp decline in prices from last year’s levels. The report from the Commerce Department followed data last week showing a surge in permits for future single-family housing construction. With confidence among homebuilders rising to a 10-month high in May, there are no signs yet that a recent tightening in credit conditions is weighing on the housing market. Housing has been hit particularly hard by the Federal Reserve’s fastest interest rate hiking cycle since the 1980s. Conrad DeQuadros, senior economic advisor at Brean Capital in New York wrote, “The evidence continues to accumulate that the housing market may have largely adjusted to the higher level of mortgage rates but the decline in the median home price is consistent with the hypothesis that home builders may be tailoring the construction of new homes towards first-time buyers.”
The vast majority of the U.S. economy continued to grow this month, according to a pair of surveys from S&P Global, but manufacturing activity continued to lag. S&P’s “flash” U.S. services-sector index rose to a 13-month high of 55.1 in its latest reading, up from 53.6 in April. However, the U.S. manufacturing sector slipped 1.4 points to 51. Still, that reading was higher than Wall Street forecasts. Chris Williamson, chief business economist at S&P Global stated, “The US economic expansion gathered further momentum in May, but an increasing dichotomy is evident.”
Minutes released from the Federal Reserve’s latest meeting showed officials were divided over where to go with interest rates, with some members seeing the need for more increases while others expected a slowdown in growth to remove the need to tighten further. Though the decision to increase the Fed’s benchmark rate by a quarter percentage point was unanimous, the meeting summary reflected disagreement over what the next move should be, with a tilt toward less aggressive policy. At the end, the rate-setting Federal Open Market Committee voted to remove a key phrase from its post-meeting statement that had indicated “additional policy firming may be appropriate.” The Fed appears now to be moving toward a more data-dependent approach in which myriad factors will determine if the rate-hiking cycle continues. “Participants generally expressed uncertainty about how much more policy tightening may be appropriate,” the minutes said.
International Economic News: Households in Canada are in more debt than those in any other G7 country, and the amount they owe is more than the value of the country’s entire economy, according to Canada’s housing agency. In a report released by Canada Mortgage and Housing Corporation, which backstops much of the country’s housing market via mortgage insurance, it stated Canada’s economy is more at risk to whatever crises may arise because of how much debt Canadian households have accumulated. Household debt now sits at 107 per cent of Canada’s GDP, the report notes, a ratio which has marched “inexorably” higher in recent years.
Across the Atlantic, the International Monetary Fund now expects the United Kingdom’s economy to avoid a recession this year after sharply upgrading its growth forecast. It now expects the UK to grow by 0.4% in 2023 helped by “resilient demand” and falling energy prices. But the IMF said inflation “remains stubbornly high” and that higher interest rates will need to remain in place if it is to be brought down. The IMF’s managing director Kristalina Georgieva said the upgraded growth figure had been sparked by falling energy prices, easing concerns over Brexit and improved financial stability.
On Europe’s mainland, French business activity grew at its slowest pace in four months in May as manufacturing continued to contract and growth in the dominant services sector decelerated. The HCOB Purchasing Managers Index (PMI) flash reading for France’s services sector in May, compiled by S&P Global, stood at 52.8 points, down from 54.6 in April and lagging forecasts for a reading of 54.0 points. The HCOB flash PMI for manufacturing showed a decline in activity but fared slightly better than expected, rising to 46.1 in May from 45.6 in April and outperforming forecasts for a reading of 46.0 points. The flash reading for the May composite PMI – which comprises both the services and manufacturing sectors – fell to 51.4 points, its lowest level since a January reading of 49.0, and down from 52.4 points in April.
Germany entered a technical recession in the first quarter of this year according to its official statistics office. Data from Destatis showed a downward revision to Germany’s GDP in the first quarter from zero to -0.3%. This comes following a 0.5% contraction in the last quarter of 2022. Two consecutive quarters of negative growth define a technical recession. According to the statistics office, German households spent a lot less in the first quarter, with final consumption expenditure falling 1.2% over that period, as consumers were reluctant to spend their cash on clothing, furnishing, cars and so on. The latest economic development takes place against a backdrop of high inflation and high interest rates across the region. The European Central Bank is expected to raise rates again at its next meeting on June 15.
In Asia, Russia’s prime minister signed a set of agreements during a trip to Beijing, describing bilateral ties at an unprecedented high, despite disapproval from the West as the war in Ukraine dragged on. Prime Minister Mikhail Mishustin — the highest-ranking Russian official to visit Beijing since Moscow invaded Ukraine in Feb. 2022 — held talks with Chinese Premier Li Qiang and met with President Xi Jinping. The memorandums of understanding signed included an agreement to deepen investment cooperation in trade services, a pact on export of agricultural products to China, and another on sports cooperation.
Japan’s government raised its overall view of the economy for the first time in ten months in May, after recent data showed the country emerged from recession in the first quarter amid a post-COVID consumption rebound. The Cabinet Office also upgraded its assessment of consumer spending, exports and factory output, suggesting economic and social activities gathered pace. “The economy is recovering moderately,” the Cabinet Office said in its monthly report. Previously, it said the economy was picking up moderately though there was some weakness. “The economy has entered a self-sustainable recovery phase,” said an official at the Cabinet Office. Furthermore, the government expects the Bank of Japan to achieve its 2% inflation target in a sustainable and stable manner backed by wage increases.
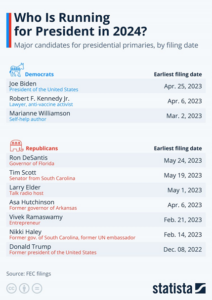
Finally: in an announcement marred by technical glitches Florida Governor Ron Desantis announced his intention to run for President of the United States in 2024 this week. His announcement followed former President Donald Trump’s in December and a handful of others since. On the Democrats’ side, President Joe Biden, self-help author Marianne Williamson, and Robert F. Kennedy Jr., nephew of JFK, have all thrown their hat in the ring so far.
(Sources: All index- and returns-data from Norgate Data and Commodity Systems Incorporated; news from Reuters, Barron’s, Wall St. Journal, Bloomberg.com, ft.com, guggenheimpartners.com, zerohedge.com, ritholtz.com, markit.com, financialpost.com, Eurostat, Statistics Canada, Yahoo! Finance, stocksandnews.com, marketwatch.com, wantchinatimes.com, BBC, 361capital.com, pensionpartners.com, cnbc.com, FactSet.) Content provided by WE Sherman and Company. Securities offered through Registered Representatives of Cambridge Investment Research Inc., a broker-dealer, member FINRA/SIPC. Advisory Services offered through Cambridge Investment Research Advisors, a Registered Investment Adviser. Strategic Investment Partners and Cambridge are not affiliated. Indices mentioned are unmanaged and cannot be invested into directly. Past performance is no guarantee of future results. These opinions of Strategic Investment Partners and not necessarily those of Cambridge Investment Research, are for informational purposes only and should not be construed or acted upon as individualized investment advice.